OPEN-SOURCE SCRIPT
8.05.2026
First of all,
huge thanks and respect to all the traders, coders, Pine Script developers, Smart Money Concepts researchers, and TradingView community members whose ideas, concepts, and open discussions inspired this indicator.
This project is not about inventing something entirely new — it is a compilation, refinement, and integration of many powerful trading concepts developed and shared by others over the years.
I simply combined these ideas into one workflow and adapted them into a unified visual trading environment.
Special appreciation goes to everyone who contributed concepts related to Fair Value Gaps (FVG), Supply & Demand, BOS structures, MACD divergences, multi-timeframe moving averages, session ranges, opening ranges, and trend visualization systems.
Without the collective creativity of the trading community, this indicator would not exist.
AS Multi-Concept Trading Framework
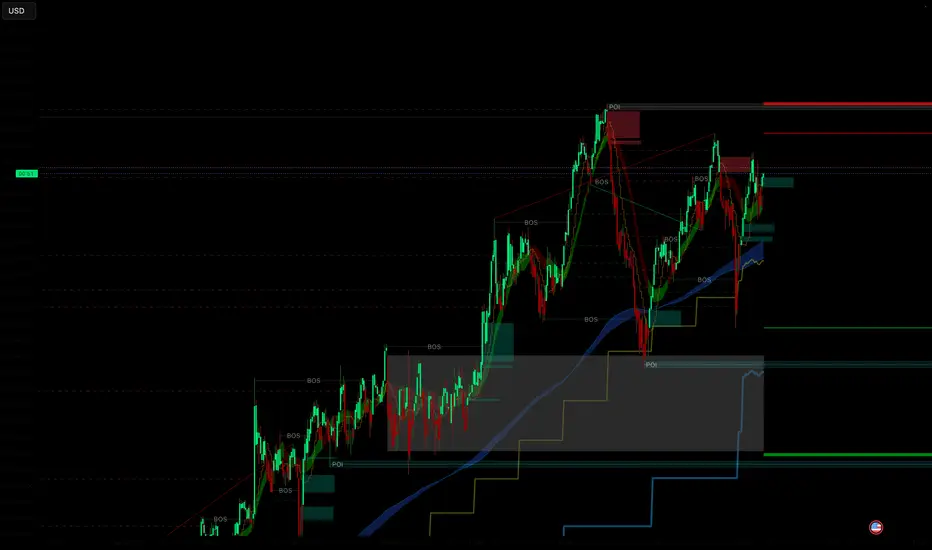
This indicator is a comprehensive multi-layer market structure and trend analysis framework built for TradingView using Pine Script v6.
It combines trend-following tools, Smart Money Concepts (SMC), liquidity analysis, momentum confirmation, session mapping, and market structure visualization into a single integrated system.
The goal of the indicator is not to predict the market, but to visually organize important information in a clean and actionable way.
Main Features
1. Multi-Layer Trend Engine
The script combines several moving average systems:
SMA 9 (stepline visualization)
SMA 20
SMA 200
EMA 200
Additional configurable multi-timeframe MAs
The indicator dynamically colors:
candles,
moving average zones,
trend regions,
EMA/SMA relationships,
allowing traders to instantly recognize trend direction and momentum conditions.
2. Fair Value Gap (FVG) Detection
Integrated Smart Money Concepts Fair Value Gap engine:
Features:
Bullish and bearish FVG detection
Dynamic or static FVG zones
Mitigation tracking
Unmitigated level display
Multi-timeframe FVG analysis
Statistical dashboard
Extendable imbalance zones
The system visually tracks liquidity inefficiencies and highlights areas where price may revisit in the future.
3. Supply & Demand Zones
Advanced Supply & Demand engine with:
Swing high / swing low detection
Automatic zone creation
BOS (Break of Structure) conversion
POI (Point of Interest) labeling
ATR-based zone sizing
Overlap filtering
Dynamic zone extension
This module helps identify institutional accumulation and distribution areas.
4. Market Structure Visualization
The indicator includes market structure tools such as:
HH / HL / LH / LL labeling
ZigZag structure mapping
BOS visualization
Swing analysis
This helps traders understand whether the market is trending, ranging, accumulating, or distributing.
5. MACD-AS Momentum & Divergences
Custom MACD-AS implementation including:
Momentum histogram
Smoothed signal line
Bullish divergences
Bearish divergences
Pivot-based divergence detection
The divergence engine helps identify potential reversals and momentum exhaustion.
6. Multi-Timeframe Moving Average System
The script supports configurable moving averages across different timeframes:
SMA
EMA
RMA / SMMA
WMA
VWMA
Each MA can independently use its own timeframe and smoothing type, allowing advanced higher-timeframe market alignment.
7. Session & Opening Range Visualization
Integrated global market session tracking:
Asia
Japan
Europe (London)
US
New York
Custom Poland session (end of the day)
Each session can generate:
Opening Range boxes
Dynamic session highs/lows
Liquidity range visualization
This helps traders identify volatility transitions and session-based liquidity behavior.
8. 15-Minute Liquidity Ranges
The indicator continuously calculates:
Live liquidity ranges
Non-repainting range highs/lows
Higher timeframe support/resistance zones
Useful for intraday liquidity targeting and range expansion analysis.
9. Alert System
Built-in alerts include:
Bullish FVG
Bearish FVG
SMA9 bullish crossover
SMA9 bearish crossover
The alert engine is designed to provide lightweight but meaningful market notifications.
Design Philosophy:
This indicator is designed as a visual decision-support framework rather than a mechanical signal generator.
The focus is on:
context,
liquidity,
structure,
momentum,
higher timeframe alignment,
institutional behavior visualization.
It is intended for discretionary traders who combine multiple concepts into a unified market reading process.
Important Notes:
Some modules may repaint depending on selected settings and timeframe requests.
Multi-timeframe calculations can behave differently in real-time and historical bars.
The indicator is highly visual and intended to be customized according to individual trading styles.
This tool should not be considered financial advice.
Final Thanks
Once again, sincere thanks to the TradingView community, open-source Pine Script authors, SMC educators, quantitative traders, and all developers whose work inspired parts of this framework.
This script is a tribute to collaborative learning in trading and technical analysis.
huge thanks and respect to all the traders, coders, Pine Script developers, Smart Money Concepts researchers, and TradingView community members whose ideas, concepts, and open discussions inspired this indicator.
This project is not about inventing something entirely new — it is a compilation, refinement, and integration of many powerful trading concepts developed and shared by others over the years.
I simply combined these ideas into one workflow and adapted them into a unified visual trading environment.
Special appreciation goes to everyone who contributed concepts related to Fair Value Gaps (FVG), Supply & Demand, BOS structures, MACD divergences, multi-timeframe moving averages, session ranges, opening ranges, and trend visualization systems.
Without the collective creativity of the trading community, this indicator would not exist.
AS Multi-Concept Trading Framework
This indicator is a comprehensive multi-layer market structure and trend analysis framework built for TradingView using Pine Script v6.
It combines trend-following tools, Smart Money Concepts (SMC), liquidity analysis, momentum confirmation, session mapping, and market structure visualization into a single integrated system.
The goal of the indicator is not to predict the market, but to visually organize important information in a clean and actionable way.
Main Features
1. Multi-Layer Trend Engine
The script combines several moving average systems:
SMA 9 (stepline visualization)
SMA 20
SMA 200
EMA 200
Additional configurable multi-timeframe MAs
The indicator dynamically colors:
candles,
moving average zones,
trend regions,
EMA/SMA relationships,
allowing traders to instantly recognize trend direction and momentum conditions.
2. Fair Value Gap (FVG) Detection
Integrated Smart Money Concepts Fair Value Gap engine:
Features:
Bullish and bearish FVG detection
Dynamic or static FVG zones
Mitigation tracking
Unmitigated level display
Multi-timeframe FVG analysis
Statistical dashboard
Extendable imbalance zones
The system visually tracks liquidity inefficiencies and highlights areas where price may revisit in the future.
3. Supply & Demand Zones
Advanced Supply & Demand engine with:
Swing high / swing low detection
Automatic zone creation
BOS (Break of Structure) conversion
POI (Point of Interest) labeling
ATR-based zone sizing
Overlap filtering
Dynamic zone extension
This module helps identify institutional accumulation and distribution areas.
4. Market Structure Visualization
The indicator includes market structure tools such as:
HH / HL / LH / LL labeling
ZigZag structure mapping
BOS visualization
Swing analysis
This helps traders understand whether the market is trending, ranging, accumulating, or distributing.
5. MACD-AS Momentum & Divergences
Custom MACD-AS implementation including:
Momentum histogram
Smoothed signal line
Bullish divergences
Bearish divergences
Pivot-based divergence detection
The divergence engine helps identify potential reversals and momentum exhaustion.
6. Multi-Timeframe Moving Average System
The script supports configurable moving averages across different timeframes:
SMA
EMA
RMA / SMMA
WMA
VWMA
Each MA can independently use its own timeframe and smoothing type, allowing advanced higher-timeframe market alignment.
7. Session & Opening Range Visualization
Integrated global market session tracking:
Asia
Japan
Europe (London)
US
New York
Custom Poland session (end of the day)
Each session can generate:
Opening Range boxes
Dynamic session highs/lows
Liquidity range visualization
This helps traders identify volatility transitions and session-based liquidity behavior.
8. 15-Minute Liquidity Ranges
The indicator continuously calculates:
Live liquidity ranges
Non-repainting range highs/lows
Higher timeframe support/resistance zones
Useful for intraday liquidity targeting and range expansion analysis.
9. Alert System
Built-in alerts include:
Bullish FVG
Bearish FVG
SMA9 bullish crossover
SMA9 bearish crossover
The alert engine is designed to provide lightweight but meaningful market notifications.
Design Philosophy:
This indicator is designed as a visual decision-support framework rather than a mechanical signal generator.
The focus is on:
context,
liquidity,
structure,
momentum,
higher timeframe alignment,
institutional behavior visualization.
It is intended for discretionary traders who combine multiple concepts into a unified market reading process.
Important Notes:
Some modules may repaint depending on selected settings and timeframe requests.
Multi-timeframe calculations can behave differently in real-time and historical bars.
The indicator is highly visual and intended to be customized according to individual trading styles.
This tool should not be considered financial advice.
Final Thanks
Once again, sincere thanks to the TradingView community, open-source Pine Script authors, SMC educators, quantitative traders, and all developers whose work inspired parts of this framework.
This script is a tribute to collaborative learning in trading and technical analysis.
Skrip sumber terbuka
Dalam semangat TradingView sebenar, pencipta skrip ini telah menjadikannya sumber terbuka, jadi pedagang boleh menilai dan mengesahkan kefungsiannya. Terima kasih kepada penulis! Walaupuan anda boleh menggunakan secara percuma, ingat bahawa penerbitan semula kod ini tertakluk kepada Peraturan Dalaman.

Penafian
Maklumat dan penerbitan adalah tidak bertujuan, dan tidak membentuk, nasihat atau cadangan kewangan, pelaburan, dagangan atau jenis lain yang diberikan atau disahkan oleh TradingView. Baca lebih dalam Terma Penggunaan.
Skrip sumber terbuka
Dalam semangat TradingView sebenar, pencipta skrip ini telah menjadikannya sumber terbuka, jadi pedagang boleh menilai dan mengesahkan kefungsiannya. Terima kasih kepada penulis! Walaupuan anda boleh menggunakan secara percuma, ingat bahawa penerbitan semula kod ini tertakluk kepada Peraturan Dalaman.
Penafian
Maklumat dan penerbitan adalah tidak bertujuan, dan tidak membentuk, nasihat atau cadangan kewangan, pelaburan, dagangan atau jenis lain yang diberikan atau disahkan oleh TradingView. Baca lebih dalam Terma Penggunaan.