OPEN-SOURCE SCRIPT
Aurora Volatility Bands [JOAT]
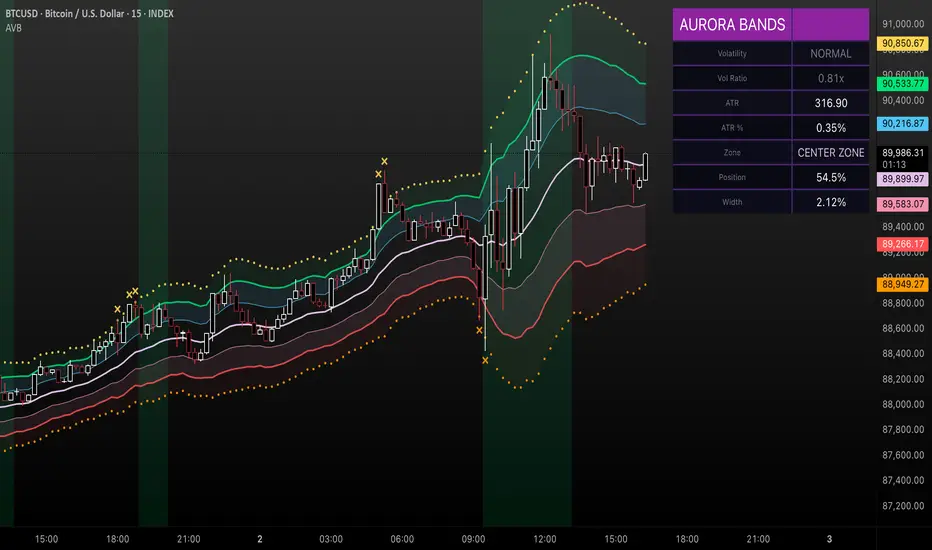
Aurora Volatility Bands [JOAT] - Dynamic ATR-Based Envelope System
Introduction and Purpose
Aurora Volatility Bands is an open-source overlay indicator that creates multi-layered volatility envelopes around price using ATR (Average True Range) calculations. The core problem this indicator solves is that static bands (like fixed percentage envelopes) fail to adapt to changing market conditions. During high volatility, static bands are too tight; during low volatility, they're too wide.
This indicator addresses that by using ATR-based dynamic bands that automatically expand during volatile periods and contract during quiet periods, providing contextually appropriate support/resistance levels at all times.
Why These Components Work Together
The indicator combines three analytical approaches:
1. Triple-Layer Band System - Inner (1x ATR), Outer (2x ATR), and Extreme (3x ATR) bands provide graduated levels of significance
2. Volatility State Detection - Compares current ATR to historical average to classify market regime
3. Multiple MA Types - Allows customization of the center line calculation method
These components complement each other:
How the Calculation Works
The bands are calculated using ATR multiplied by configurable factors:
Pine Script®
Volatility state is determined by comparing current ATR percentage to its historical average:
Pine Script®
Signal Types
Dashboard Information
Using SMA in settings:

How to Use This Indicator
For Mean-Reversion Trading:
1. Wait for price to touch outer or extreme bands
2. Check that volatility state is NORMAL or CONTRACTING (not expanding)
3. Look for reversal candlestick patterns at the band
4. Enter toward center MA with stop beyond the band
For Breakout Trading:
1. Wait for volatility state to show EXPANDING
2. Look for price closing beyond outer bands
3. Enter in direction of breakout
4. Use the band as trailing stop reference
For Volatility Analysis:
1. Monitor volatility ratio for regime changes
2. CONTRACTING often precedes large moves (squeeze)
3. EXPANDING confirms trend strength
Using VWMA and Mean Reversion Signal/MR:

Input Parameters
Timeframe Recommendations
Limitations
Open-Source and Disclaimer
This script is published as open-source under the Mozilla Public License 2.0 for educational purposes. The source code is fully visible and can be studied to understand how each component works.
This indicator does not constitute financial advice. Band touches do not guarantee reversals. Past performance does not guarantee future results. Always use proper risk management, position sizing, and stop-losses.
- Made with passion by officialjackofalltrades
Introduction and Purpose
Aurora Volatility Bands is an open-source overlay indicator that creates multi-layered volatility envelopes around price using ATR (Average True Range) calculations. The core problem this indicator solves is that static bands (like fixed percentage envelopes) fail to adapt to changing market conditions. During high volatility, static bands are too tight; during low volatility, they're too wide.
This indicator addresses that by using ATR-based dynamic bands that automatically expand during volatile periods and contract during quiet periods, providing contextually appropriate support/resistance levels at all times.
Why These Components Work Together
The indicator combines three analytical approaches:
1. Triple-Layer Band System - Inner (1x ATR), Outer (2x ATR), and Extreme (3x ATR) bands provide graduated levels of significance
2. Volatility State Detection - Compares current ATR to historical average to classify market regime
3. Multiple MA Types - Allows customization of the center line calculation method
These components complement each other:
- The triple-layer system gives traders multiple reference points - inner bands for normal moves, outer for significant moves, extreme for rare events
- Volatility state detection tells you WHEN bands are expanding or contracting, helping anticipate breakouts or mean-reversion
- MA type selection lets you match the indicator to your trading style (faster EMA vs smoother SMA)
How the Calculation Works
The bands are calculated using ATR multiplied by configurable factors:
Volatility state is determined by comparing current ATR percentage to its historical average:
Signal Types
- Band Touch - Price reaches inner, outer, or extreme bands
- Mean Reversion - Price returns to center after touching outer/extreme bands
- Breakout - Sustained move beyond outer bands during volatility expansion
Dashboard Information
- Volatility - Current state (EXPANDING/CONTRACTING/NORMAL)
- Vol Ratio - Current volatility vs average (e.g., 1.5x = 50% above average)
- ATR - Current ATR value
- ATR % - ATR as percentage of price
- Zone - Current price position (EXTREME HIGH/UPPER ZONE/CENTER ZONE/etc.)
- Position - Price position as percentage within band structure
- Width - Total band width as percentage of price
Using SMA in settings:
How to Use This Indicator
For Mean-Reversion Trading:
1. Wait for price to touch outer or extreme bands
2. Check that volatility state is NORMAL or CONTRACTING (not expanding)
3. Look for reversal candlestick patterns at the band
4. Enter toward center MA with stop beyond the band
For Breakout Trading:
1. Wait for volatility state to show EXPANDING
2. Look for price closing beyond outer bands
3. Enter in direction of breakout
4. Use the band as trailing stop reference
For Volatility Analysis:
1. Monitor volatility ratio for regime changes
2. CONTRACTING often precedes large moves (squeeze)
3. EXPANDING confirms trend strength
Using VWMA and Mean Reversion Signal/MR:
Input Parameters
- ATR Period (14) - Period for ATR calculation
- Inner/Outer/Extreme Multipliers (1.0/2.0/3.0) - Band distance from center
- MA Type (EMA) - Center line calculation method
- MA Period (20) - Period for center line
- Volatility Comparison Period (20) - Lookback for volatility state
Timeframe Recommendations
- 15m-1H: Good for intraday mean-reversion
- 4H-Daily: Best for swing trading and breakout identification
- Weekly: Useful for position trading and major level identification
Limitations
- ATR-based bands lag during sudden volatility spikes
- Mean-reversion signals can fail in strong trends
- Breakout signals may whipsaw in ranging markets
- Works best on liquid instruments with consistent volatility patterns
Open-Source and Disclaimer
This script is published as open-source under the Mozilla Public License 2.0 for educational purposes. The source code is fully visible and can be studied to understand how each component works.
This indicator does not constitute financial advice. Band touches do not guarantee reversals. Past performance does not guarantee future results. Always use proper risk management, position sizing, and stop-losses.
- Made with passion by officialjackofalltrades
Skrip sumber terbuka
Dalam semangat TradingView sebenar, pencipta skrip ini telah menjadikannya sumber terbuka, jadi pedagang boleh menilai dan mengesahkan kefungsiannya. Terima kasih kepada penulis! Walaupuan anda boleh menggunakan secara percuma, ingat bahawa penerbitan semula kod ini tertakluk kepada Peraturan Dalaman.

The Institutional Grade Trading Ecosystem, Built to win trades 📈
Get Access 👇
jackofalltrades.vip 🌐
t.me/jackofalltradesvip 🃏
Get Access 👇
jackofalltrades.vip 🌐
t.me/jackofalltradesvip 🃏
Penafian
Maklumat dan penerbitan adalah tidak bertujuan, dan tidak membentuk, nasihat atau cadangan kewangan, pelaburan, dagangan atau jenis lain yang diberikan atau disahkan oleh TradingView. Baca lebih dalam Terma Penggunaan.
Skrip sumber terbuka
Dalam semangat TradingView sebenar, pencipta skrip ini telah menjadikannya sumber terbuka, jadi pedagang boleh menilai dan mengesahkan kefungsiannya. Terima kasih kepada penulis! Walaupuan anda boleh menggunakan secara percuma, ingat bahawa penerbitan semula kod ini tertakluk kepada Peraturan Dalaman.
The Institutional Grade Trading Ecosystem, Built to win trades 📈
Get Access 👇
jackofalltrades.vip 🌐
t.me/jackofalltradesvip 🃏
Get Access 👇
jackofalltrades.vip 🌐
t.me/jackofalltradesvip 🃏
Penafian
Maklumat dan penerbitan adalah tidak bertujuan, dan tidak membentuk, nasihat atau cadangan kewangan, pelaburan, dagangan atau jenis lain yang diberikan atau disahkan oleh TradingView. Baca lebih dalam Terma Penggunaan.