Composite Regime Oscillator v6 - Clean Confirmed Reversal
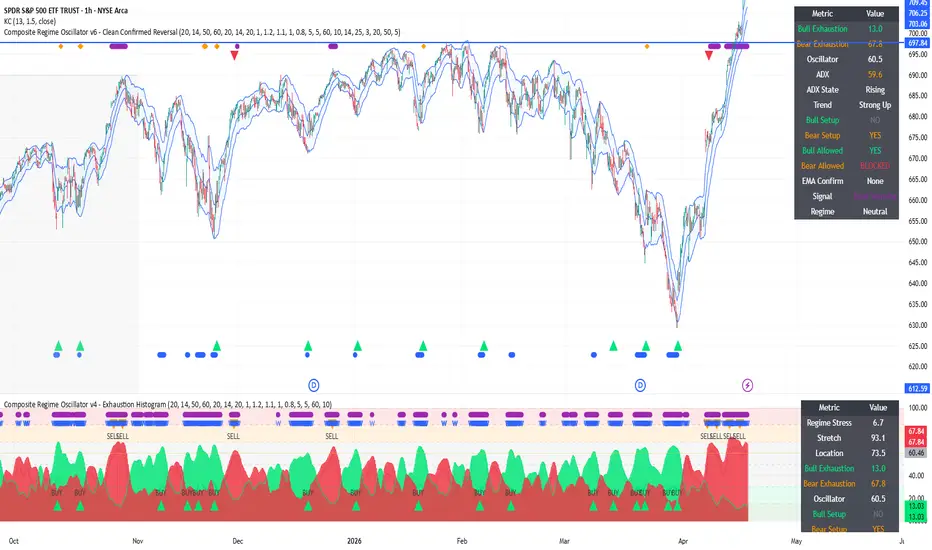
Composite Regime Oscillator v6 – Clean Exhaustion Histogram
Overview
This indicator detects **trend exhaustion** and highlights potential **reversal zones** using a multi-factor model.
Instead of relying on a single condition (like RSI), it combines:
* volatility expansion
* price stretch from equilibrium
* range positioning
* momentum extremes
* volume / pressure
The goal is simple:
> identify when a move becomes unstable and more likely to **reverse or pull back**
---
What makes this indicator different
Most oscillators fail in strong trends — they call tops and bottoms too early.
This script solves that using:
Setup + Trigger + Filter logic
* **Setup** → market is stretched / exhausted
* **Trigger** → price or momentum starts to turn
* **Filter** → strong trends are filtered (ADX + trend structure)
This prevents constant false signals during strong moves.
---
Visual Signals (Clean System)
All signals are shape-based (no text clutter):
* ▲ Green triangle → confirmed bullish reversal
* ▼ Red triangle → confirmed bearish reversal
* ● Blue circle → bullish warning (early exhaustion)
* ● Purple circle → bearish warning (early exhaustion)
* ◆ Orange diamond → trend exhaustion / momentum cooling
---
What the histogram shows
Green histogram (Bullish Exhaustion)
* downside pressure weakening
* panic / oversold conditions
* potential bottoming phase
Red histogram (Bearish Exhaustion)
* upside pressure weakening
* overbought / euphoric conditions
* potential topping phase
Oscillator line
* low → washed out
* mid → neutral
* high → strong momentum / overheating
---
How to use it
---
1. Confirmed Reversal Mode (ADX ON)
Best for:
* swing trading
* cleaner entries
* avoiding fake signals in strong trends
Signals appear only when:
* exhaustion is present
* reversal trigger appears
* trend starts weakening
👉 Interpretation:
**Not just stretched — trend is actually breaking**
2. Aggressive / Scalping Mode (ADX OFF)
Best for:
* scalping
* intraday trading
* early entries
* quick pullbacks
Signals appear earlier because:
* no trend filter
* no ADX restriction
👉 Interpretation:
**Market is stretched and likely to react (not always fully reverse)**
---
Practical usage
Clean chart (recommended)
* Confirmed Signals = ON
* Warnings = OFF
* Exhaustion Markers = OFF
→ Only triangles → clean and focused
---
Full context mode
* Confirmed Signals = ON
* Warnings = ON
* Exhaustion Markers = ON
→ See full market condition
---
How to read the market
Strong trend
* many warning circles
* few confirmed signals
→ trend still healthy
---
Weakening trend
* orange diamonds appear
* warnings reduce
* then triangle appears
→ higher probability reversal
---
Works best in
* extended trends
* volatility expansions
* emotional market phases
---
Works worse in
* tight ranges
* low volatility chop
* slow grinding trends
---
Best used with
* support / resistance
* liquidity zones
* Keltner / Bollinger bands
* RSI divergence
* market structure breaks
* higher timeframe bias
---
Summary
This indicator answers one question:
> **Is the trend still strong — or starting to break?**
* Triangles → confirmed reversals
* Circles → early warnings
* Diamonds → momentum fading
With ADX:
→ cleaner, slower, more reliable
Without ADX:
→ faster, noisier, more aggressive
Final note
This is **not a trend-following indicator**.
It is designed for:
* exhaustion detection
* reversal timing
* identifying unstable price moves
Use it with context — not in isolation.
Overview
This indicator detects **trend exhaustion** and highlights potential **reversal zones** using a multi-factor model.
Instead of relying on a single condition (like RSI), it combines:
* volatility expansion
* price stretch from equilibrium
* range positioning
* momentum extremes
* volume / pressure
The goal is simple:
> identify when a move becomes unstable and more likely to **reverse or pull back**
---
What makes this indicator different
Most oscillators fail in strong trends — they call tops and bottoms too early.
This script solves that using:
Setup + Trigger + Filter logic
* **Setup** → market is stretched / exhausted
* **Trigger** → price or momentum starts to turn
* **Filter** → strong trends are filtered (ADX + trend structure)
This prevents constant false signals during strong moves.
---
Visual Signals (Clean System)
All signals are shape-based (no text clutter):
* ▲ Green triangle → confirmed bullish reversal
* ▼ Red triangle → confirmed bearish reversal
* ● Blue circle → bullish warning (early exhaustion)
* ● Purple circle → bearish warning (early exhaustion)
* ◆ Orange diamond → trend exhaustion / momentum cooling
---
What the histogram shows
Green histogram (Bullish Exhaustion)
* downside pressure weakening
* panic / oversold conditions
* potential bottoming phase
Red histogram (Bearish Exhaustion)
* upside pressure weakening
* overbought / euphoric conditions
* potential topping phase
Oscillator line
* low → washed out
* mid → neutral
* high → strong momentum / overheating
---
How to use it
---
1. Confirmed Reversal Mode (ADX ON)
Best for:
* swing trading
* cleaner entries
* avoiding fake signals in strong trends
Signals appear only when:
* exhaustion is present
* reversal trigger appears
* trend starts weakening
👉 Interpretation:
**Not just stretched — trend is actually breaking**
2. Aggressive / Scalping Mode (ADX OFF)
Best for:
* scalping
* intraday trading
* early entries
* quick pullbacks
Signals appear earlier because:
* no trend filter
* no ADX restriction
👉 Interpretation:
**Market is stretched and likely to react (not always fully reverse)**
---
Practical usage
Clean chart (recommended)
* Confirmed Signals = ON
* Warnings = OFF
* Exhaustion Markers = OFF
→ Only triangles → clean and focused
---
Full context mode
* Confirmed Signals = ON
* Warnings = ON
* Exhaustion Markers = ON
→ See full market condition
---
How to read the market
Strong trend
* many warning circles
* few confirmed signals
→ trend still healthy
---
Weakening trend
* orange diamonds appear
* warnings reduce
* then triangle appears
→ higher probability reversal
---
Works best in
* extended trends
* volatility expansions
* emotional market phases
---
Works worse in
* tight ranges
* low volatility chop
* slow grinding trends
---
Best used with
* support / resistance
* liquidity zones
* Keltner / Bollinger bands
* RSI divergence
* market structure breaks
* higher timeframe bias
---
Summary
This indicator answers one question:
> **Is the trend still strong — or starting to break?**
* Triangles → confirmed reversals
* Circles → early warnings
* Diamonds → momentum fading
With ADX:
→ cleaner, slower, more reliable
Without ADX:
→ faster, noisier, more aggressive
Final note
This is **not a trend-following indicator**.
It is designed for:
* exhaustion detection
* reversal timing
* identifying unstable price moves
Use it with context — not in isolation.

Penafian
Maklumat dan penerbitan adalah tidak bertujuan, dan tidak membentuk, nasihat atau cadangan kewangan, pelaburan, dagangan atau jenis lain yang diberikan atau disahkan oleh TradingView. Baca lebih dalam Terma Penggunaan.
Penafian
Maklumat dan penerbitan adalah tidak bertujuan, dan tidak membentuk, nasihat atau cadangan kewangan, pelaburan, dagangan atau jenis lain yang diberikan atau disahkan oleh TradingView. Baca lebih dalam Terma Penggunaan.