OPEN-SOURCE SCRIPT
Mag7 + SPY Multi-Decade Seasonality
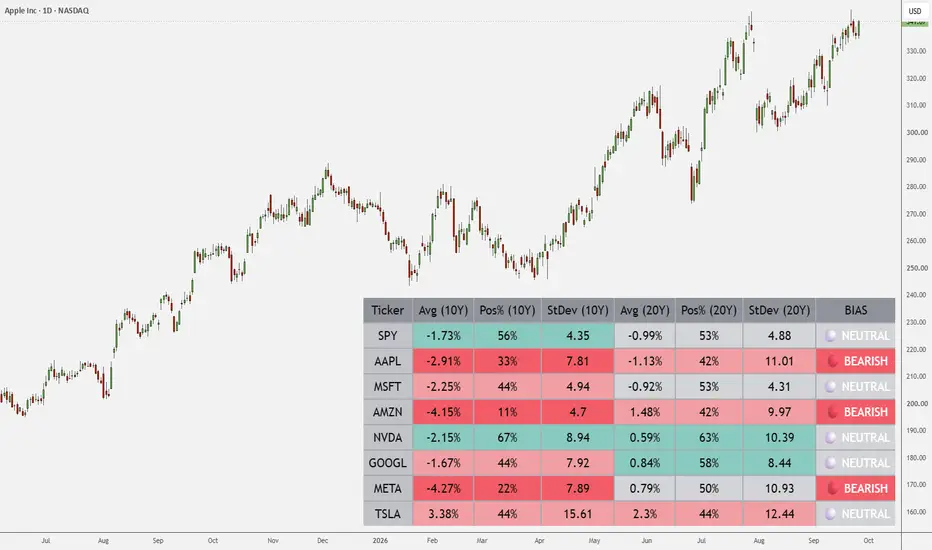
📊 Overview
The Mag7 + SPY Seasonal Dashboard tracks historical monthly seasonality across the Magnificent 7 (AAPL, MSFT, AMZN, NVDA, GOOGL, META, TSLA) and the SPY benchmark.
It dynamically pulls monthly timeframe data (1M) for the current calendar month and calculates multi-period historical metrics over 10-Year and 20-Year lookback windows.
⚙️ Key Tracked Metrics:
- Avg Return (Avg): Average historical percentage return for the current calendar month.
- Win Rate (Pos%): Percentage of historical years where the current month closed positive.
- Volatility (StDev): Standard deviation of historical monthly returns for dispersion analysis.
- Institutional BIAS:
🟢 BULLISH: Pos% (10Y) $\ge$ 70% AND Pos% (20Y) $\ge$ 60%.
🔴 BEARISH: Pos% (10Y) $\le$ 40% OR Pos% (20Y) $\le$ 40%.
⚪ NEUTRAL: Mixed or balanced historical performance.
🎯 How to Use:
- Apply the indicator overlay to any chart (the dashboard uses fixed 1M security requests, so chart timeframe won't alter the table).
- Scan the BIAS column for strong cross-period alignment between the 10-year and 20-year windows.
- Combine directional seasonal bias with technical market structure and intraday execution triggers.
The Mag7 + SPY Seasonal Dashboard tracks historical monthly seasonality across the Magnificent 7 (AAPL, MSFT, AMZN, NVDA, GOOGL, META, TSLA) and the SPY benchmark.
It dynamically pulls monthly timeframe data (1M) for the current calendar month and calculates multi-period historical metrics over 10-Year and 20-Year lookback windows.
⚙️ Key Tracked Metrics:
- Avg Return (Avg): Average historical percentage return for the current calendar month.
- Win Rate (Pos%): Percentage of historical years where the current month closed positive.
- Volatility (StDev): Standard deviation of historical monthly returns for dispersion analysis.
- Institutional BIAS:
🟢 BULLISH: Pos% (10Y) $\ge$ 70% AND Pos% (20Y) $\ge$ 60%.
🔴 BEARISH: Pos% (10Y) $\le$ 40% OR Pos% (20Y) $\le$ 40%.
⚪ NEUTRAL: Mixed or balanced historical performance.
🎯 How to Use:
- Apply the indicator overlay to any chart (the dashboard uses fixed 1M security requests, so chart timeframe won't alter the table).
- Scan the BIAS column for strong cross-period alignment between the 10-year and 20-year windows.
- Combine directional seasonal bias with technical market structure and intraday execution triggers.
Skrip sumber terbuka
Dalam semangat TradingView sebenar, pencipta skrip ini telah menjadikannya sumber terbuka, jadi pedagang boleh menilai dan mengesahkan kefungsiannya. Terima kasih kepada penulis! Walaupuan anda boleh menggunakan secara percuma, ingat bahawa penerbitan semula kod ini tertakluk kepada Peraturan Dalaman.

Penafian
Maklumat dan penerbitan adalah tidak bertujuan, dan tidak membentuk, nasihat atau cadangan kewangan, pelaburan, dagangan atau jenis lain yang diberikan atau disahkan oleh TradingView. Baca lebih dalam Terma Penggunaan.
Skrip sumber terbuka
Dalam semangat TradingView sebenar, pencipta skrip ini telah menjadikannya sumber terbuka, jadi pedagang boleh menilai dan mengesahkan kefungsiannya. Terima kasih kepada penulis! Walaupuan anda boleh menggunakan secara percuma, ingat bahawa penerbitan semula kod ini tertakluk kepada Peraturan Dalaman.
Penafian
Maklumat dan penerbitan adalah tidak bertujuan, dan tidak membentuk, nasihat atau cadangan kewangan, pelaburan, dagangan atau jenis lain yang diberikan atau disahkan oleh TradingView. Baca lebih dalam Terma Penggunaan.