RSI Trap [XWiseTrade]
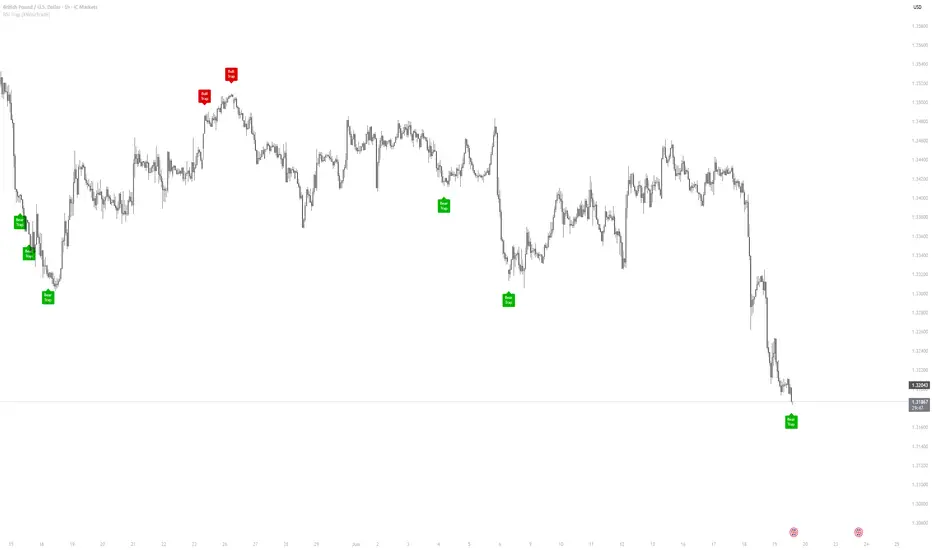
RSI Trap
Most traders read RSI the textbook way: above 70 means overbought, expect a pullback; below 30 means oversold, expect a bounce. RSI Trap is built on the opposite read — and on the one thing the textbook ignores: volume.
The idea
When RSI is overbought and price keeps making new highs, but volume is fading, the conventional trader shorts the "overbought" market. They get trapped. Here's why: if price advances to new highs without volume, there is no one selling into it — no resistance, no defense above. A market that climbs on thin volume isn't exhausted; it's meeting no opposition, and tends to keep going. The trap is sprung on everyone who faded the extreme.
The mirror applies to the downside: oversold, new lows, fading volume — no buyers stepping in, no support below — and the dip-buyers get trapped.
What it shows
Why three conditions, not one
RSI alone fires on every extreme and stays pinned in trends — pure noise.
This requires the extreme to coincide with (a) price still breaking to new highs/lows and (b) contracting volume, isolating the specific case where an "overbought/oversold" reading actually signals continuation rather than reversal.
Inputs
RSI length, overbought/oversold levels, volume average length, low-volume fraction, new-high/low lookback, cooldown.
Built-in alerts both directions. These are descriptive market-structure signals for discretionary use, not buy/sell recommendations.
Most traders read RSI the textbook way: above 70 means overbought, expect a pullback; below 30 means oversold, expect a bounce. RSI Trap is built on the opposite read — and on the one thing the textbook ignores: volume.
The idea
When RSI is overbought and price keeps making new highs, but volume is fading, the conventional trader shorts the "overbought" market. They get trapped. Here's why: if price advances to new highs without volume, there is no one selling into it — no resistance, no defense above. A market that climbs on thin volume isn't exhausted; it's meeting no opposition, and tends to keep going. The trap is sprung on everyone who faded the extreme.
The mirror applies to the downside: oversold, new lows, fading volume — no buyers stepping in, no support below — and the dip-buyers get trapped.
What it shows
- Bull Trap — overbought + new highs + fading volume → no resistance above, uptrend likely continues (traps shorts)
- Bear Trap — oversold + new lows + fading volume → no support below, downtrend likely continues (traps dip-buyers)
- Labels on the candle, with a cooldown to avoid clustering
Why three conditions, not one
RSI alone fires on every extreme and stays pinned in trends — pure noise.
This requires the extreme to coincide with (a) price still breaking to new highs/lows and (b) contracting volume, isolating the specific case where an "overbought/oversold" reading actually signals continuation rather than reversal.
Inputs
RSI length, overbought/oversold levels, volume average length, low-volume fraction, new-high/low lookback, cooldown.
Built-in alerts both directions. These are descriptive market-structure signals for discretionary use, not buy/sell recommendations.

Free tools & education → xwisetrade.com | Community → discord.gg/BUVfRjey2u
Penafian
Maklumat dan penerbitan adalah tidak bertujuan, dan tidak membentuk, nasihat atau cadangan kewangan, pelaburan, dagangan atau jenis lain yang diberikan atau disahkan oleh TradingView. Baca lebih dalam Terma Penggunaan.
Free tools & education → xwisetrade.com | Community → discord.gg/BUVfRjey2u
Penafian
Maklumat dan penerbitan adalah tidak bertujuan, dan tidak membentuk, nasihat atau cadangan kewangan, pelaburan, dagangan atau jenis lain yang diberikan atau disahkan oleh TradingView. Baca lebih dalam Terma Penggunaan.