OPEN-SOURCE SCRIPT
Telah dikemas kini Blue Moons Monthly and Quarterly/Seasonal 2000 thru 2035 EST
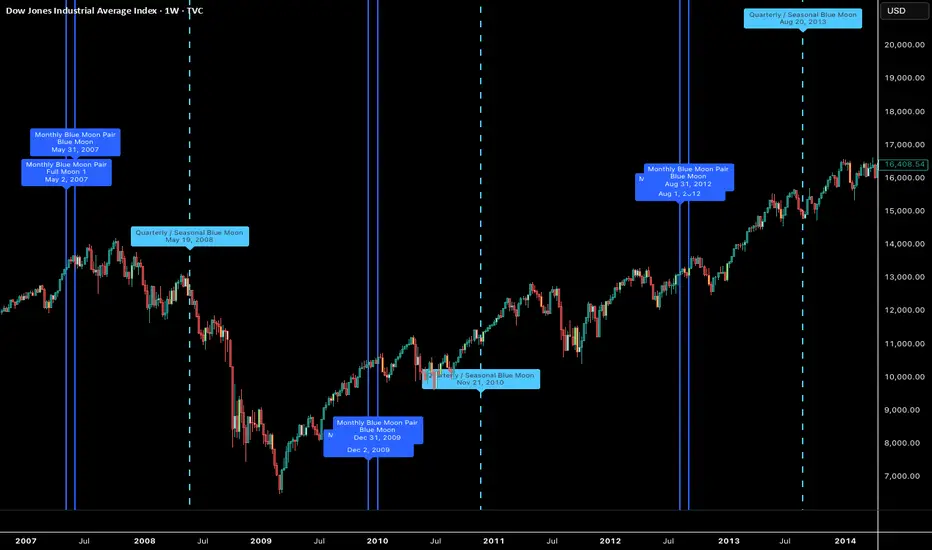
This indicator marks historical and projected Blue Moon events on the chart from 2000 through 2035, using fixed Eastern Standard Time (EST / UTC−5).
The script includes both major Blue Moon definitions:
Monthly Blue Moons
A monthly Blue Moon occurs when there are two Full Moons in the same calendar month. This script marks both Full Moons in each Blue Moon month with solid blue vertical lines.
Quarterly / Seasonal Blue Moons
A quarterly or seasonal Blue Moon occurs when an astronomical season contains four Full Moons instead of the usual three. The Blue Moon is the third Full Moon in that season. These are marked with dashed light-blue vertical lines.
The purpose of this indicator is to help visually study potential market correlations around rare lunar timing events. It is designed for historical research, cycle analysis, and astro-financial timing studies.
The script includes both major Blue Moon definitions:
Monthly Blue Moons
A monthly Blue Moon occurs when there are two Full Moons in the same calendar month. This script marks both Full Moons in each Blue Moon month with solid blue vertical lines.
Quarterly / Seasonal Blue Moons
A quarterly or seasonal Blue Moon occurs when an astronomical season contains four Full Moons instead of the usual three. The Blue Moon is the third Full Moon in that season. These are marked with dashed light-blue vertical lines.
The purpose of this indicator is to help visually study potential market correlations around rare lunar timing events. It is designed for historical research, cycle analysis, and astro-financial timing studies.
Nota Keluaran
Prior Script was not printing the future events - correction here. Skrip sumber terbuka
Dalam semangat TradingView sebenar, pencipta skrip ini telah menjadikannya sumber terbuka, jadi pedagang boleh menilai dan mengesahkan kefungsiannya. Terima kasih kepada penulis! Walaupuan anda boleh menggunakan secara percuma, ingat bahawa penerbitan semula kod ini tertakluk kepada Peraturan Dalaman.

Penafian
Maklumat dan penerbitan adalah tidak bertujuan, dan tidak membentuk, nasihat atau cadangan kewangan, pelaburan, dagangan atau jenis lain yang diberikan atau disahkan oleh TradingView. Baca lebih dalam Terma Penggunaan.
Skrip sumber terbuka
Dalam semangat TradingView sebenar, pencipta skrip ini telah menjadikannya sumber terbuka, jadi pedagang boleh menilai dan mengesahkan kefungsiannya. Terima kasih kepada penulis! Walaupuan anda boleh menggunakan secara percuma, ingat bahawa penerbitan semula kod ini tertakluk kepada Peraturan Dalaman.
Penafian
Maklumat dan penerbitan adalah tidak bertujuan, dan tidak membentuk, nasihat atau cadangan kewangan, pelaburan, dagangan atau jenis lain yang diberikan atau disahkan oleh TradingView. Baca lebih dalam Terma Penggunaan.