Higher Timeframe Trend Frontier (Zeiierman)
More exclusive indicators from Zeiierman
Subscribe to Zeiierman for $95.20/month to get exclusive indicators by this author. You pay right on TradingView and can use them on your charts straight away.
Explore Zeiierman█ Overview
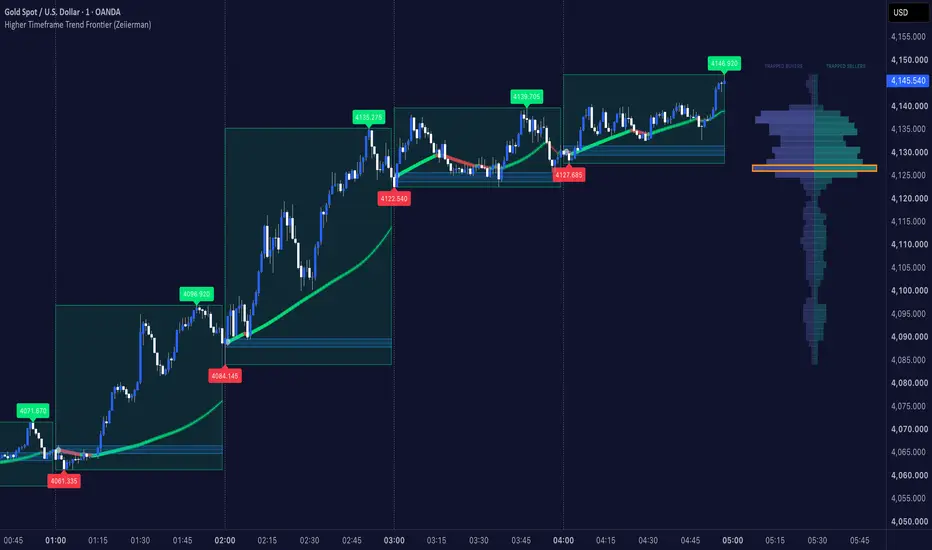
Higher Timeframe Trend Frontier (Zeiierman) is an adaptive higher-timeframe indicator designed to visualize HTF opening levels, developing price structure, directional movement, and potential trapped buyers and sellers.

Unlike traditional HTF indicators that simply plot historical highs, lows, and opening prices, Trend Frontier combines higher-timeframe structure with an adaptive price-tracking model and a two-sided market-pressure profile.
The indicator consists of four core components:
• HTF Structure: Developing higher-timeframe price ranges, opening levels, and directional states.
• Opening Zone: Volatility-adjusted price reference surrounding each HTF opening price.
• Trend Frontier: Adaptive directional line driven by ATR, historical price reactions, and HTF acceleration.
• Trapped Buyers & Sellers Profile: Estimated concentrations of vulnerable buying and selling participation across recent HTF structure.
Together, these components provide traders with a structured view of higher-timeframe price development, directional pressure, and potential reaction areas.

█ How It Works
█ How to Use
Higher Timeframe Trend Frontier can be used for HTF Opening-Level Analysis, Trend Continuation, Price-Reaction Trading, and Identifying Potential Trapped Participation.
⚪ Trading Around HTF Opening Levels
The opening zone provides a reference for determining how price develops relative to the beginning of each higher-timeframe period.
• Bullish Development: Price establishes acceptance above the opening region.
• Bearish Development: Price establishes acceptance below the opening region.
• Neutral Development: Price repeatedly crosses the opening region without maintaining direction.
Traders can monitor reactions around these levels to assess developing higher-timeframe conditions.

⚪ Trend Continuation
The adaptive Trend Frontier acts as a dynamic reference for identifying potential trend continuation opportunities through price retests.
Bullish Continuation:
When price trades above the HTF opening zone and the Frontier is rising, a pullback toward the Frontier can present a potential bullish continuation opportunity.
• Bullish Retest: Price approaches or touches the Frontier from above and subsequently rejects lower prices, indicating a potential continuation higher.
Bearish Continuation:
When price trades below the HTF opening zone and the Frontier is declining, a recovery toward the Frontier can present a potential bearish continuation opportunity.
• Bearish Retest: Price approaches or touches the Frontier from below and subsequently rejects higher prices, indicating a potential continuation lower.

█ Settings
-----------------
Disclaimer
The content provided in my scripts, indicators, ideas, algorithms, and systems is for educational and informational purposes only. It does not constitute financial advice, investment recommendations, or a solicitation to buy or sell any financial instruments. I will not accept liability for any loss or damage, including without limitation any loss of profit, which may arise directly or indirectly from the use of or reliance on such information.
All investments involve risk, and the past performance of a security, industry, sector, market, financial product, trading strategy, backtest, or individual's trading does not guarantee future results or returns. Investors are fully responsible for any investment decisions they make. Such decisions should be based solely on an evaluation of their financial circumstances, investment objectives, risk tolerance, and liquidity needs.
Higher Timeframe Trend Frontier (Zeiierman) is an adaptive higher-timeframe indicator designed to visualize HTF opening levels, developing price structure, directional movement, and potential trapped buyers and sellers.
Unlike traditional HTF indicators that simply plot historical highs, lows, and opening prices, Trend Frontier combines higher-timeframe structure with an adaptive price-tracking model and a two-sided market-pressure profile.
The indicator consists of four core components:
• HTF Structure: Developing higher-timeframe price ranges, opening levels, and directional states.
• Opening Zone: Volatility-adjusted price reference surrounding each HTF opening price.
• Trend Frontier: Adaptive directional line driven by ATR, historical price reactions, and HTF acceleration.
• Trapped Buyers & Sellers Profile: Estimated concentrations of vulnerable buying and selling participation across recent HTF structure.
Together, these components provide traders with a structured view of higher-timeframe price development, directional pressure, and potential reaction areas.
█ How It Works
⚪ Higher Timeframe Structure
The indicator divides price action into periods determined by the selected Higher Timeframe.
Each period creates a box that continuously tracks the highest and lowest prices reached.
• Bullish HTF Box: Price trades at or above the HTF opening price.
• Bearish HTF Box: Price trades below the HTF opening price.
• High / Low Labels: Display the prices and locations of each period’s extremes.
• Vertical Dividers: Separate individual higher-timeframe periods.
The developing box updates as new candles form. Its directional color can change whenever price crosses the HTF opening price.
⚪ HTF ATR Opening Zone
Each HTF period includes an opening zone calculated using the ATR of the previous completed higher-timeframe period.
Instead of displaying only the exact opening price, the indicator creates a volatility-adjusted region around it.
Opening Zone CalculationPine Script®
⚪ Adaptive Trend Frontier
The Trend Frontier is a directional price-tracking model that resets at the beginning of every HTF period.
Unlike a conventional moving average, the Frontier begins at the HTF opening price and advances toward current price using ATR-based movement.
Its responsiveness is adjusted through historical price-reaction memory and a time-dependent acceleration mechanism.
Frontier MovementPine Script®
The Frontier moves toward price without exceeding the remaining price distance during an update.
Late-HTF Acceleration
As the HTF period approaches completion, the Frontier can automatically increase its movement speed. By default, acceleration begins after 70% of the HTF period has elapsed.
Acceleration CalculationPine Script®
This allows the Frontier to become more responsive during the final portion of each higher-timeframe period.
⚪ Trapped Buyers & Sellers Profile
The Trap Profile analyzes the latest three HTF periods, including the developing period, to estimate where buyers and sellers may be under pressure.
The combined highest high and lowest low establish the profile’s price range, which is divided into configurable horizontal rows.
Unlike a conventional Volume Profile, this model combines several factors:
• Estimated buying and selling participation from candle structure
• Volume distributed across individual price levels
• Bullish and bearish HTF directional states
• Upper- and lower-wick rejection
• Adverse price movement relative to current price
• Recency weighting across the three HTF periods
█ How to Use
Higher Timeframe Trend Frontier can be used for HTF Opening-Level Analysis, Trend Continuation, Price-Reaction Trading, and Identifying Potential Trapped Participation.
⚪ Trading Around HTF Opening Levels
The opening zone provides a reference for determining how price develops relative to the beginning of each higher-timeframe period.
• Bullish Development: Price establishes acceptance above the opening region.
• Bearish Development: Price establishes acceptance below the opening region.
• Neutral Development: Price repeatedly crosses the opening region without maintaining direction.
Traders can monitor reactions around these levels to assess developing higher-timeframe conditions.
⚪ Trend Continuation
The adaptive Trend Frontier acts as a dynamic reference for identifying potential trend continuation opportunities through price retests.
Bullish Continuation:
When price trades above the HTF opening zone and the Frontier is rising, a pullback toward the Frontier can present a potential bullish continuation opportunity.
• Bullish Retest: Price approaches or touches the Frontier from above and subsequently rejects lower prices, indicating a potential continuation higher.
Bearish Continuation:
When price trades below the HTF opening zone and the Frontier is declining, a recovery toward the Frontier can present a potential bearish continuation opportunity.
• Bearish Retest: Price approaches or touches the Frontier from below and subsequently rejects higher prices, indicating a potential continuation lower.
█ Settings
- Higher Timeframe: Selects the timeframe used for HTF boxes, opening levels, and Frontier calculations. Must be higher than the chart timeframe.
- Frontier Colors: Customize the bullish and bearish Frontier colors.
- Colored HTF Boxes: Enable developing HTF ranges and customize their bullish and bearish colors.
- Price Labels: Display HTF highs and lows with customizable colors and sizes.
- HTF ATR Opening Zone: Enable the opening-price region and adjust its ATR multiplier and color.
- Vertical Dividers: Show or hide separators between HTF periods.
- Frontier Speed: Controls how quickly the adaptive Frontier follows price, measured in chart ATR units.
- Late-HTF Acceleration: Enables faster Frontier movement near the end of each HTF period.
- Start After HTF Progress (%): Determines when acceleration begins. Default: 70%.
- Final Speed Multiplier: Controls the maximum acceleration multiplier. Default: 3.0.
- Acceleration Curve: Adjusts how gradually or sharply acceleration increases.
- Trapped Buyers / Sellers Profile: Enables the estimated two-sided pressure profile.
- Price Rows: Determines the profile's price-level resolution. Default: 48.
- Offset / Side Width: Adjusts the profile's horizontal position and width.
- Profile Colors: Customize trapped-buyer and trapped-seller colors.
- Normalize Each Side: Independently scales each profile to its strongest concentration or uses a shared scale for comparison.
-----------------
Disclaimer
The content provided in my scripts, indicators, ideas, algorithms, and systems is for educational and informational purposes only. It does not constitute financial advice, investment recommendations, or a solicitation to buy or sell any financial instruments. I will not accept liability for any loss or damage, including without limitation any loss of profit, which may arise directly or indirectly from the use of or reliance on such information.
All investments involve risk, and the past performance of a security, industry, sector, market, financial product, trading strategy, backtest, or individual's trading does not guarantee future results or returns. Investors are fully responsible for any investment decisions they make. Such decisions should be based solely on an evaluation of their financial circumstances, investment objectives, risk tolerance, and liquidity needs.

Access my indicators at: zeiierman.com
Join Our Free Discord: discord.gg/zeiiermantrading
Join Our Free Discord: discord.gg/zeiiermantrading
Penafian
Maklumat dan penerbitan adalah tidak bertujuan, dan tidak membentuk, nasihat atau cadangan kewangan, pelaburan, dagangan atau jenis lain yang diberikan atau disahkan oleh TradingView. Baca lebih dalam Terma Penggunaan.
Access my indicators at: zeiierman.com
Join Our Free Discord: discord.gg/zeiiermantrading
Join Our Free Discord: discord.gg/zeiiermantrading
Penafian
Maklumat dan penerbitan adalah tidak bertujuan, dan tidak membentuk, nasihat atau cadangan kewangan, pelaburan, dagangan atau jenis lain yang diberikan atau disahkan oleh TradingView. Baca lebih dalam Terma Penggunaan.