EMA/MA Toolkit
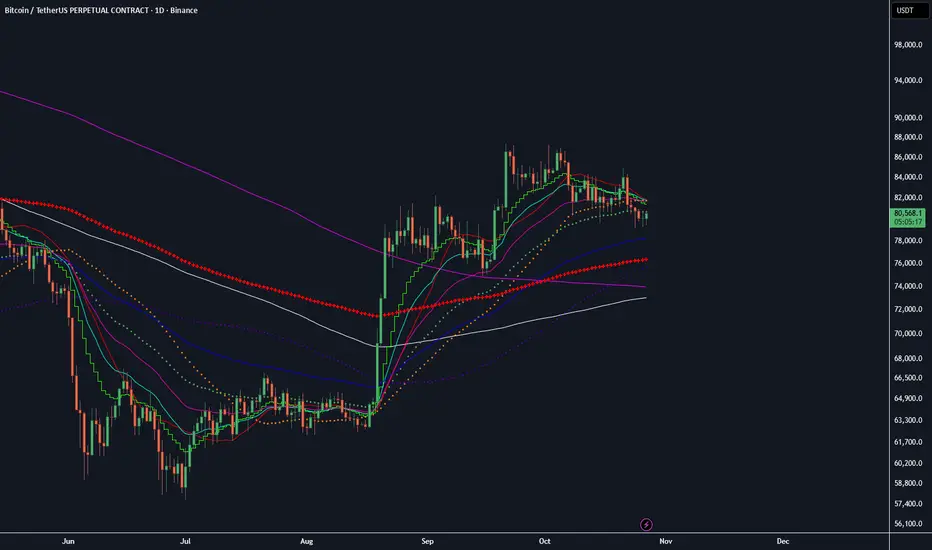
EMA & MA Calculations
The toolkit combines 11 independently configurable moving averages.
Simple Moving Averages (SMA)
- MA20, MA50, MA100, MA200, MA300
- Calculated using the arithmetic mean of the selected price source over the specified number of periods.
- Primarily used to evaluate intermediate and long-term trend direction and potential dynamic support and resistance.
Exponential Moving Averages (EMA)
- EMA13, EMA21, EMA34, EMA50, EMA89, EMA200
- Calculated using standard exponential smoothing, with a weighting multiplier of 2 / (length + 1).
- More recent prices receive greater weight, allowing these averages to react more quickly to price changes than simple moving averages of equivalent length.
The shorter-period EMAs help visualize momentum changes, while the longer-period EMAs provide additional context for broader trend direction.
All averages are calculated using the selected price source and the chart's active timeframe. Individual periods, sources, and plotting styles can be customized through the indicator settings.
The toolkit also provides separate visibility controls for the SMA and EMA groups.
The toolkit combines 11 independently configurable moving averages.
Simple Moving Averages (SMA)
- MA20, MA50, MA100, MA200, MA300
- Calculated using the arithmetic mean of the selected price source over the specified number of periods.
- Primarily used to evaluate intermediate and long-term trend direction and potential dynamic support and resistance.
Exponential Moving Averages (EMA)
- EMA13, EMA21, EMA34, EMA50, EMA89, EMA200
- Calculated using standard exponential smoothing, with a weighting multiplier of 2 / (length + 1).
- More recent prices receive greater weight, allowing these averages to react more quickly to price changes than simple moving averages of equivalent length.
The shorter-period EMAs help visualize momentum changes, while the longer-period EMAs provide additional context for broader trend direction.
All averages are calculated using the selected price source and the chart's active timeframe. Individual periods, sources, and plotting styles can be customized through the indicator settings.
The toolkit also provides separate visibility controls for the SMA and EMA groups.

Penafian
Maklumat dan penerbitan adalah tidak bertujuan, dan tidak membentuk, nasihat atau cadangan kewangan, pelaburan, dagangan atau jenis lain yang diberikan atau disahkan oleh TradingView. Baca lebih dalam Terma Penggunaan.
Penafian
Maklumat dan penerbitan adalah tidak bertujuan, dan tidak membentuk, nasihat atau cadangan kewangan, pelaburan, dagangan atau jenis lain yang diberikan atau disahkan oleh TradingView. Baca lebih dalam Terma Penggunaan.