Fearzone Exhaustion Signals
■ Overview
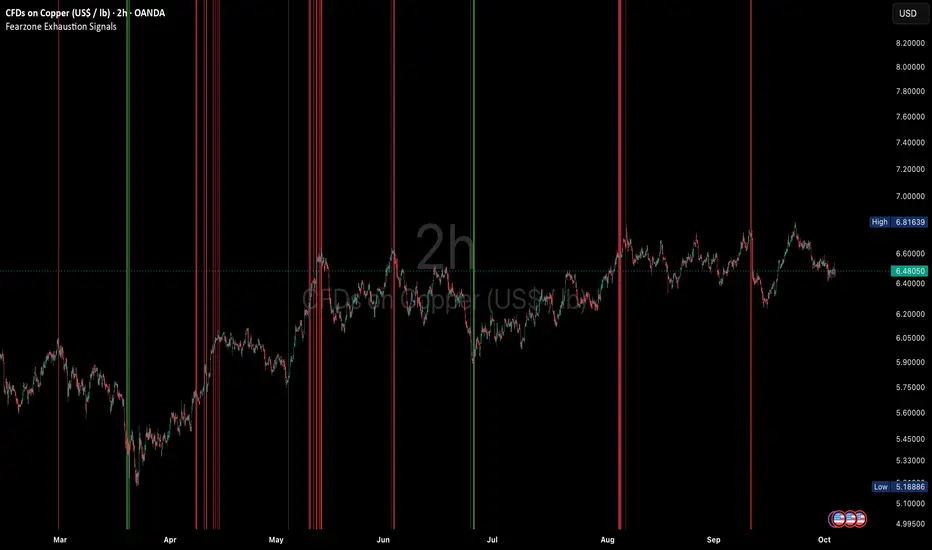
This indicator highlights bars where an overextended move starts to lose strength. A red background marks a possible short entry, and a green background marks a possible long entry.
Long signals are stricter than short signals. A long signal also requires a fear condition, so it appears only after a clear sell-off.
【Image: chart with red and green backgrounds】
■ How a signal is made
1. Overextension
Two RSIs, a short-term one and a long-term one, are calculated on smoothed prices. Both must be above 90 for a short, or below 10 for a long.
2. Fading momentum
The MACD histogram must be shrinking: above zero and lower than the previous bar for a short, below zero and higher than the previous bar for a long.
3. State filter
The efficiency ratio and the speed of the move (in ATRs per bar) classify the market as accelerating, pausing, or moving gently. By default, signals are skipped during a gentle, steady trend, where counter-trend entries tend to fail.
4. Fearzone (long only)
A long signal is shown only when the Fearzone condition is active: the drop from the recent high is larger than usual, and the smoothed price is lower than usual.
■ Settings
・Parameters: MA type, MA lengths, and the RSI levels
・MACD: the original MACD built from the two MAs, or the standard 12, 26, 9
・State Filter: on or off, and how strict it is
・Fearzone: periods, moving average type, and how many bars count as an overlap
・Display: show or hide each side, colors, and transparency
・Alert Settings: turn each side on or off
■ Alerts
Create an alert and select "Any alert() function call" to receive both sides in one alert. It fires once when the bar closes. The message includes the symbol and timeframe, for example "Long Signal: BTCUSDT (15)".
You can also choose "Long" or "Short" in the alert dialog to set them up separately. Use one of the two ways, not both.
■ Limitations
・Signals are counter-trend. In a strong one-directional move, price may continue after a signal.
・The indicator does not provide stop loss or take profit levels.
・Results differ by symbol and timeframe. Check recent signals before relying on them.
■ Credits
The Fearzone condition is based on "Fearzone - Contrarian Indicator" by Zeiierman, used under CC BY-NC-SA 4.0. This script is shared under the same license.
■ Disclaimer
For research and educational purposes only. This is not financial advice. Past signals do not guarantee future results.
This indicator highlights bars where an overextended move starts to lose strength. A red background marks a possible short entry, and a green background marks a possible long entry.
Long signals are stricter than short signals. A long signal also requires a fear condition, so it appears only after a clear sell-off.
【Image: chart with red and green backgrounds】
■ How a signal is made
1. Overextension
Two RSIs, a short-term one and a long-term one, are calculated on smoothed prices. Both must be above 90 for a short, or below 10 for a long.
2. Fading momentum
The MACD histogram must be shrinking: above zero and lower than the previous bar for a short, below zero and higher than the previous bar for a long.
3. State filter
The efficiency ratio and the speed of the move (in ATRs per bar) classify the market as accelerating, pausing, or moving gently. By default, signals are skipped during a gentle, steady trend, where counter-trend entries tend to fail.
4. Fearzone (long only)
A long signal is shown only when the Fearzone condition is active: the drop from the recent high is larger than usual, and the smoothed price is lower than usual.
■ Settings
・Parameters: MA type, MA lengths, and the RSI levels
・MACD: the original MACD built from the two MAs, or the standard 12, 26, 9
・State Filter: on or off, and how strict it is
・Fearzone: periods, moving average type, and how many bars count as an overlap
・Display: show or hide each side, colors, and transparency
・Alert Settings: turn each side on or off
■ Alerts
Create an alert and select "Any alert() function call" to receive both sides in one alert. It fires once when the bar closes. The message includes the symbol and timeframe, for example "Long Signal: BTCUSDT (15)".
You can also choose "Long" or "Short" in the alert dialog to set them up separately. Use one of the two ways, not both.
■ Limitations
・Signals are counter-trend. In a strong one-directional move, price may continue after a signal.
・The indicator does not provide stop loss or take profit levels.
・Results differ by symbol and timeframe. Check recent signals before relying on them.
■ Credits
The Fearzone condition is based on "Fearzone - Contrarian Indicator" by Zeiierman, used under CC BY-NC-SA 4.0. This script is shared under the same license.
■ Disclaimer
For research and educational purposes only. This is not financial advice. Past signals do not guarantee future results.

Penafian
Maklumat dan penerbitan adalah tidak bertujuan, dan tidak membentuk, nasihat atau cadangan kewangan, pelaburan, dagangan atau jenis lain yang diberikan atau disahkan oleh TradingView. Baca lebih dalam Terma Penggunaan.
Penafian
Maklumat dan penerbitan adalah tidak bertujuan, dan tidak membentuk, nasihat atau cadangan kewangan, pelaburan, dagangan atau jenis lain yang diberikan atau disahkan oleh TradingView. Baca lebih dalam Terma Penggunaan.