Mamis Cumulative Line
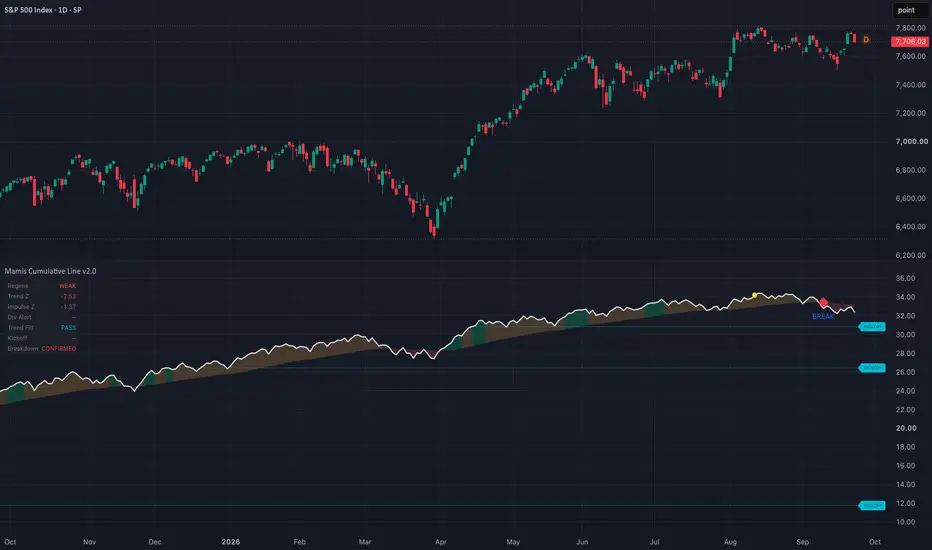
On a standard 1D chart, this indicator combines US breadth trend, thrusts and price divergence. It accumulates (advances − declines) / (advances + declines + unchanged issues) from the selected start year. Missing unchanged-issue data counts as zero.
Defaults use a 50-observation EMA and two observations to confirm regime changes. Green requires breadth at or above its EMA and above its previous three observations; amber stays at or above the EMA without the latter condition; red is below the EMA. Trend Z = (breadth-minus-EMA spread − its 252-observation mean) / its standard deviation.
KICKOFF requires the 10-observation mean breadth ratio’s 252-observation Z-score above 2, raw green conditions, price above its 100-bar EMA and more than 40 chart bars since the last event. Divergence means a higher price high with lower breadth outside green. BREAK adds red conditions, Trend Z below −1 and divergence within 30 bars.
Signals wait for daily close. Default pivots use 10 bars left and confirm five bars after the high; optional placement on the earlier pivot is retrospective. Breadth follows US sessions, so holidays/weekends affect comparisons. Feeds, revisions and loaded history affect results; the live line can change before close.
Defaults use a 50-observation EMA and two observations to confirm regime changes. Green requires breadth at or above its EMA and above its previous three observations; amber stays at or above the EMA without the latter condition; red is below the EMA. Trend Z = (breadth-minus-EMA spread − its 252-observation mean) / its standard deviation.
KICKOFF requires the 10-observation mean breadth ratio’s 252-observation Z-score above 2, raw green conditions, price above its 100-bar EMA and more than 40 chart bars since the last event. Divergence means a higher price high with lower breadth outside green. BREAK adds red conditions, Trend Z below −1 and divergence within 30 bars.
Signals wait for daily close. Default pivots use 10 bars left and confirm five bars after the high; optional placement on the earlier pivot is retrospective. Breadth follows US sessions, so holidays/weekends affect comparisons. Feeds, revisions and loaded history affect results; the live line can change before close.

Penafian
Maklumat dan penerbitan adalah tidak bertujuan, dan tidak membentuk, nasihat atau cadangan kewangan, pelaburan, dagangan atau jenis lain yang diberikan atau disahkan oleh TradingView. Baca lebih dalam Terma Penggunaan.
Penafian
Maklumat dan penerbitan adalah tidak bertujuan, dan tidak membentuk, nasihat atau cadangan kewangan, pelaburan, dagangan atau jenis lain yang diberikan atau disahkan oleh TradingView. Baca lebih dalam Terma Penggunaan.