OPEN-SOURCE SCRIPT
Shaakuni - Liquidity Levels & Order Blocks
Overview
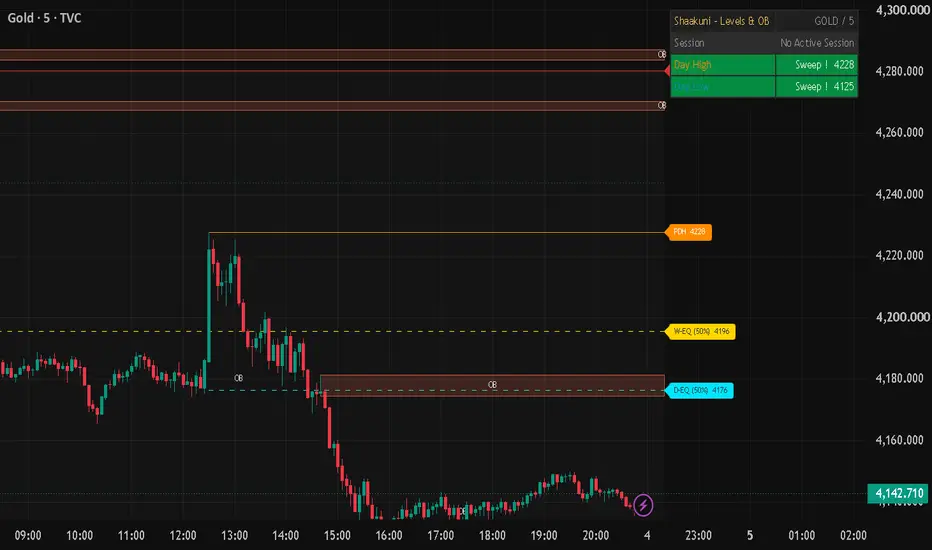
Shaakuni - Liquidity Levels & Order Blocks is a context tool for intraday and swing charts. It draws the previous week's and previous day's highs and lows, marks the midpoint of each range, finds simple Order Blocks (zones where a strong move started), and shows a small panel with the active trading session and what price is doing around yesterday's high and low. It does not generate buy or sell signals and it does not predict anything. It only organizes reference areas on the chart so you can read price against them.
Key concepts
Liquidity levels: many traders place stop orders just beyond obvious highs and lows, such as the previous day's high or the previous week's low. Because of this, these levels are often treated as areas where price may pause, reverse or accelerate. The script draws them so you do not have to mark them by hand every day.
EQ (equilibrium): this is the 50% point between a range's high and low. Some traders treat prices above it as premium and prices below it as discount relative to that range. The script draws this midpoint for the previous week and previous day.
Order Block (OB): in this script an Order Block is the last candle of the opposite colour before a strong move that breaks recent structure. A bullish OB is the last down candle before a strong up move, and a bearish OB is the last up candle before a strong down move. The idea is that the area around that candle may matter if price returns to it. On 1H and higher timeframes the zones are labelled POI (point of interest) instead of OB.
What the script draws
Previous week high (PWH) and low (PWL) with a shaded range box and the weekly 50% line (W-EQ). The week before that is shown as thin dotted lines when "Show Previous Week" is on. Previous day high (PDH) and low (PDL) with the daily 50% line (D-EQ); daily levels are hidden on weekly and monthly charts. If a daily level sits at exactly the same price as a weekly level, the labels are merged (for example PDH / PWH). Order Blocks are drawn as boxes that extend to the right while they are untouched.
How Order Blocks are calculated
The calculation runs once per closed bar. First, the script looks back over the last N bars ("OB Structure Lookback", default 10) and finds the highest high (bullish case) or lowest low (bearish case) before the current bar. Second, if the current bar closes beyond that level, it counts as a structure break; the swing must be at least 3 bars old, so very small moves are ignored. Third, the script finds the lowest low (or highest high for the bearish case) that formed after that swing, and looks for an impulse candle between that point and the current bar: a candle in the direction of the break whose body is at least a set multiple of ATR(14) ("OB Impulse Candle", default 0.7 x ATR). If no such candle exists, no zone is created. Fourth, the Order Block is the closest opposite-coloured candle before that impulse, no further back than the swing extreme; its high-to-low range becomes the box. Fifth, the zone is kept only if price has not already traded back into it since it formed. Finally, once a later bar touches the box, the zone is marked as mitigated and, by default, hidden. Old zones are removed after a lookback that depends on the timeframe (or a manual value you set).
Important behaviour: the Order Block is drawn on the earlier candle where the zone formed, but it only appears when the bar that breaks structure closes. In other words, boxes are placed in the past after the fact. This is deliberate, but it means a zone appearing on your chart was not visible at the moment that earlier candle printed.
Session and sweep panel
The panel shows the current session in New York time (Asian 20:00-00:00, London 02:00-05:00, New York 07:00-10:00, London Close 10:00-12:00) and the status of the previous day's high and low relative to today's price. "Sweep !" means price traded beyond that level today but the latest close is back inside it. "Broken X" means the latest close is beyond the level. "Active" means neither has happened. The timezone can be automatic (handles daylight saving) or fixed to UTC-4 or UTC-5.
How to use it
Use higher-timeframe levels to frame lower-timeframe price action. For example, on a 15-minute chart, note whether price is trading near the previous day's high or the previous week's low, and whether one of them has already been swept. Treat an untouched Order Block as an area to watch and a mitigated one as already tested. Many traders combine references like these with their own confirmation and risk rules; this script is meant as a map, not a trade plan. Every element (weekly levels, daily levels, EQ lines, Order Blocks, mitigated zones, panel) can be switched off in the settings, and you can change colours, theme (dark or light), panel position and size, the OB structure lookback and the impulse size.
Why it is built this way
The ideas here (previous highs and lows, 50% levels, order blocks) are widely used and this script does not claim to have invented them. What it adds is a specific, transparent implementation in one place: Order Blocks are created only after a structure break confirmed by an ATR-scaled impulse, kept only while untouched, and removed from view once tested, and they are shown together with weekly and daily levels and a session and sweep panel so everything can be read in the same context. The source code is open, so you can check each step and adapt it.
Limitations
Weekly and daily levels are built from the bars loaded on your chart, so on low timeframes with limited history the first week or day can be incomplete. The Order Block rule is a simple mechanical approximation of a discretionary idea; it will not match every trader's definition and can create or miss zones you would not choose by eye. Mitigation is checked on every price update, so a zone can be marked as mitigated during a bar. The panel status uses the live bar and can change until the bar closes. On weekends, the most recently completed week and day are treated as the previous ones. Past reactions at a level do not guarantee future reactions. This is a visual aid and not financial advice.
Shaakuni - Liquidity Levels & Order Blocks is a context tool for intraday and swing charts. It draws the previous week's and previous day's highs and lows, marks the midpoint of each range, finds simple Order Blocks (zones where a strong move started), and shows a small panel with the active trading session and what price is doing around yesterday's high and low. It does not generate buy or sell signals and it does not predict anything. It only organizes reference areas on the chart so you can read price against them.
Key concepts
Liquidity levels: many traders place stop orders just beyond obvious highs and lows, such as the previous day's high or the previous week's low. Because of this, these levels are often treated as areas where price may pause, reverse or accelerate. The script draws them so you do not have to mark them by hand every day.
EQ (equilibrium): this is the 50% point between a range's high and low. Some traders treat prices above it as premium and prices below it as discount relative to that range. The script draws this midpoint for the previous week and previous day.
Order Block (OB): in this script an Order Block is the last candle of the opposite colour before a strong move that breaks recent structure. A bullish OB is the last down candle before a strong up move, and a bearish OB is the last up candle before a strong down move. The idea is that the area around that candle may matter if price returns to it. On 1H and higher timeframes the zones are labelled POI (point of interest) instead of OB.
What the script draws
Previous week high (PWH) and low (PWL) with a shaded range box and the weekly 50% line (W-EQ). The week before that is shown as thin dotted lines when "Show Previous Week" is on. Previous day high (PDH) and low (PDL) with the daily 50% line (D-EQ); daily levels are hidden on weekly and monthly charts. If a daily level sits at exactly the same price as a weekly level, the labels are merged (for example PDH / PWH). Order Blocks are drawn as boxes that extend to the right while they are untouched.
How Order Blocks are calculated
The calculation runs once per closed bar. First, the script looks back over the last N bars ("OB Structure Lookback", default 10) and finds the highest high (bullish case) or lowest low (bearish case) before the current bar. Second, if the current bar closes beyond that level, it counts as a structure break; the swing must be at least 3 bars old, so very small moves are ignored. Third, the script finds the lowest low (or highest high for the bearish case) that formed after that swing, and looks for an impulse candle between that point and the current bar: a candle in the direction of the break whose body is at least a set multiple of ATR(14) ("OB Impulse Candle", default 0.7 x ATR). If no such candle exists, no zone is created. Fourth, the Order Block is the closest opposite-coloured candle before that impulse, no further back than the swing extreme; its high-to-low range becomes the box. Fifth, the zone is kept only if price has not already traded back into it since it formed. Finally, once a later bar touches the box, the zone is marked as mitigated and, by default, hidden. Old zones are removed after a lookback that depends on the timeframe (or a manual value you set).
Important behaviour: the Order Block is drawn on the earlier candle where the zone formed, but it only appears when the bar that breaks structure closes. In other words, boxes are placed in the past after the fact. This is deliberate, but it means a zone appearing on your chart was not visible at the moment that earlier candle printed.
Session and sweep panel
The panel shows the current session in New York time (Asian 20:00-00:00, London 02:00-05:00, New York 07:00-10:00, London Close 10:00-12:00) and the status of the previous day's high and low relative to today's price. "Sweep !" means price traded beyond that level today but the latest close is back inside it. "Broken X" means the latest close is beyond the level. "Active" means neither has happened. The timezone can be automatic (handles daylight saving) or fixed to UTC-4 or UTC-5.
How to use it
Use higher-timeframe levels to frame lower-timeframe price action. For example, on a 15-minute chart, note whether price is trading near the previous day's high or the previous week's low, and whether one of them has already been swept. Treat an untouched Order Block as an area to watch and a mitigated one as already tested. Many traders combine references like these with their own confirmation and risk rules; this script is meant as a map, not a trade plan. Every element (weekly levels, daily levels, EQ lines, Order Blocks, mitigated zones, panel) can be switched off in the settings, and you can change colours, theme (dark or light), panel position and size, the OB structure lookback and the impulse size.
Why it is built this way
The ideas here (previous highs and lows, 50% levels, order blocks) are widely used and this script does not claim to have invented them. What it adds is a specific, transparent implementation in one place: Order Blocks are created only after a structure break confirmed by an ATR-scaled impulse, kept only while untouched, and removed from view once tested, and they are shown together with weekly and daily levels and a session and sweep panel so everything can be read in the same context. The source code is open, so you can check each step and adapt it.
Limitations
Weekly and daily levels are built from the bars loaded on your chart, so on low timeframes with limited history the first week or day can be incomplete. The Order Block rule is a simple mechanical approximation of a discretionary idea; it will not match every trader's definition and can create or miss zones you would not choose by eye. Mitigation is checked on every price update, so a zone can be marked as mitigated during a bar. The panel status uses the live bar and can change until the bar closes. On weekends, the most recently completed week and day are treated as the previous ones. Past reactions at a level do not guarantee future reactions. This is a visual aid and not financial advice.
Skrip sumber terbuka
Dalam semangat TradingView sebenar, pencipta skrip ini telah menjadikannya sumber terbuka, jadi pedagang boleh menilai dan mengesahkan kefungsiannya. Terima kasih kepada penulis! Walaupuan anda boleh menggunakan secara percuma, ingat bahawa penerbitan semula kod ini tertakluk kepada Peraturan Dalaman.

Penafian
Maklumat dan penerbitan adalah tidak bertujuan, dan tidak membentuk, nasihat atau cadangan kewangan, pelaburan, dagangan atau jenis lain yang diberikan atau disahkan oleh TradingView. Baca lebih dalam Terma Penggunaan.
Skrip sumber terbuka
Dalam semangat TradingView sebenar, pencipta skrip ini telah menjadikannya sumber terbuka, jadi pedagang boleh menilai dan mengesahkan kefungsiannya. Terima kasih kepada penulis! Walaupuan anda boleh menggunakan secara percuma, ingat bahawa penerbitan semula kod ini tertakluk kepada Peraturan Dalaman.
Penafian
Maklumat dan penerbitan adalah tidak bertujuan, dan tidak membentuk, nasihat atau cadangan kewangan, pelaburan, dagangan atau jenis lain yang diberikan atau disahkan oleh TradingView. Baca lebih dalam Terma Penggunaan.