OPEN-SOURCE SCRIPT
Telah dikemas kini Quantum RSI (TechnoBlooms)
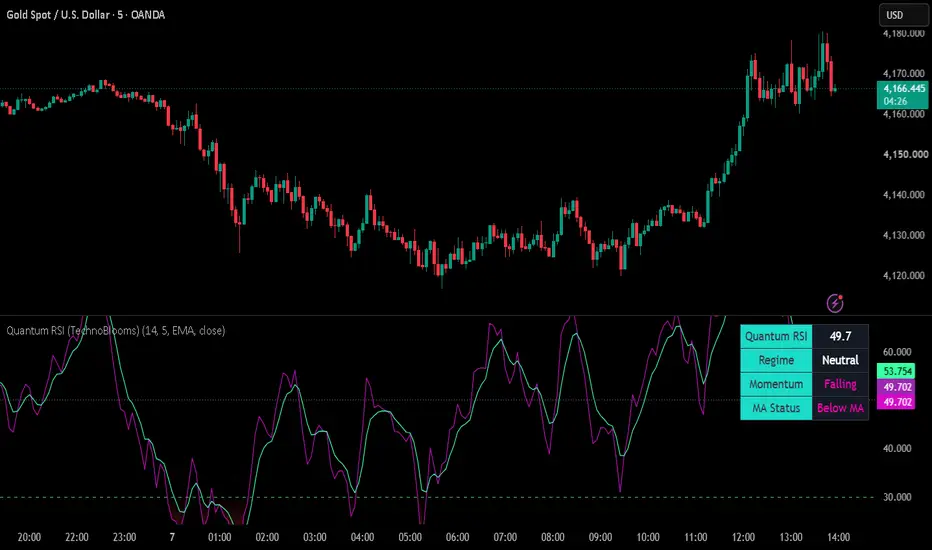
The Next Evolution of Momentum Analysis
📘 Overview
Quantum RSI is an advanced momentum oscillator based on Quantum Price Theory, designed as a superior alternative to the traditional RSI. It incorporates a Gaussian decay function to weigh price changes, creating a more responsive and intuitive measure of trend strength.
This indicator excels in identifying micro-trends and subtle momentum shifts — especially in narrow or low-volatility environments where standard RSI typically lags or gives false signals. With its enhanced smoothing, intuitive color gradients, and customizable moving average, Quantum RSI offers a powerful tool for traders seeking clarity and precision.


🔍 Key Features
• ⚛️ Quantum Momentum Engine: Measures net momentum using quantum-inspired Gaussian decay weighting.
• 🎨 Color-Reversed Gradient Zones:
o Green (Overbought): Shows momentum strength, not weakness.
o Red (Oversold): Highlights momentum exhaustion and potential bounce.


• 🧠 Smoothing with MA: Option to apply moving average (SMA/EMA/WMA/SMMA/VWMA) to the Quantum RSI line.
• 📊 Levels at 30 / 50 / 70: Standard RSI levels for decision-making guidance.
• 📈 Intuitive Visuals: Gradient fills for cleaner interpretation of zones and transitions.
👤 Who Is It For?
• Technical traders seeking a modern alternative to RSI.
• Quantitative analysts who value precision and smooth signal flow.
• Visual traders looking for intuitive, color-coded trend zones.
• Traders focused on market microstructure and early trend detection.

💡 Pro Tips
• Pair with order blocks, market structure tools, or Fibonacci confluences for high-probability entries.
• Use on assets with frequent compression or consolidation, where traditional RSI often misleads.
• Combine with volume-based indicators or smart money concepts for added confirmation.
• Ideal for sideways markets, false breakouts, or low-volatility zones where typical RSI lags.
📘 Overview
Quantum RSI is an advanced momentum oscillator based on Quantum Price Theory, designed as a superior alternative to the traditional RSI. It incorporates a Gaussian decay function to weigh price changes, creating a more responsive and intuitive measure of trend strength.
This indicator excels in identifying micro-trends and subtle momentum shifts — especially in narrow or low-volatility environments where standard RSI typically lags or gives false signals. With its enhanced smoothing, intuitive color gradients, and customizable moving average, Quantum RSI offers a powerful tool for traders seeking clarity and precision.
🔍 Key Features
• ⚛️ Quantum Momentum Engine: Measures net momentum using quantum-inspired Gaussian decay weighting.
• 🎨 Color-Reversed Gradient Zones:
o Green (Overbought): Shows momentum strength, not weakness.
o Red (Oversold): Highlights momentum exhaustion and potential bounce.
• 🧠 Smoothing with MA: Option to apply moving average (SMA/EMA/WMA/SMMA/VWMA) to the Quantum RSI line.
• 📊 Levels at 30 / 50 / 70: Standard RSI levels for decision-making guidance.
• 📈 Intuitive Visuals: Gradient fills for cleaner interpretation of zones and transitions.
👤 Who Is It For?
• Technical traders seeking a modern alternative to RSI.
• Quantitative analysts who value precision and smooth signal flow.
• Visual traders looking for intuitive, color-coded trend zones.
• Traders focused on market microstructure and early trend detection.
💡 Pro Tips
• Pair with order blocks, market structure tools, or Fibonacci confluences for high-probability entries.
• Use on assets with frequent compression or consolidation, where traditional RSI often misleads.
• Combine with volume-based indicators or smart money concepts for added confirmation.
• Ideal for sideways markets, false breakouts, or low-volatility zones where typical RSI lags.
Nota Keluaran
What's New in this UpdateWe're excited to introduce the Quantum RSI Regime Dashboard, designed to provide traders with an instant view of market conditions without having to interpret multiple signals manually.
New Features
Quantum RSI Dashboard
Market Regime Detection
Automatically classifies the market into:
- Strong Bullish
- Bullish
- Neutral
- Bearish
- Strong Bearish
Momentum Direction
Displays whether Quantum RSI momentum is:
- Rising
- Falling
- Flat
MA Relationship
This Shows the relationship between Quantum RSI and its moving average:
- Above MA
- Below MA
- At MA
Nota Keluaran
Quantum RSI DashboardAdded a professional dashboard displaying the current Quantum RSI value.
Market Regime Detection
Automatically classifies the market into:
- Strong Bullish
- Bullish
- Neutral
- Bearish
Strong Bearish
Momentum Direction
Displays whether Quantum RSI momentum is:
- Rising
- Falling
- Flat
MA Relationship
This Shows the relationship between Quantum RSI and its moving average:
- Above MA
- Below MA
- At MA
Skrip sumber terbuka
Dalam semangat TradingView sebenar, pencipta skrip ini telah menjadikannya sumber terbuka, jadi pedagang boleh menilai dan mengesahkan kefungsiannya. Terima kasih kepada penulis! Walaupuan anda boleh menggunakan secara percuma, ingat bahawa penerbitan semula kod ini tertakluk kepada Peraturan Dalaman.

Penafian
Maklumat dan penerbitan adalah tidak bertujuan, dan tidak membentuk, nasihat atau cadangan kewangan, pelaburan, dagangan atau jenis lain yang diberikan atau disahkan oleh TradingView. Baca lebih dalam Terma Penggunaan.
Skrip sumber terbuka
Dalam semangat TradingView sebenar, pencipta skrip ini telah menjadikannya sumber terbuka, jadi pedagang boleh menilai dan mengesahkan kefungsiannya. Terima kasih kepada penulis! Walaupuan anda boleh menggunakan secara percuma, ingat bahawa penerbitan semula kod ini tertakluk kepada Peraturan Dalaman.
Penafian
Maklumat dan penerbitan adalah tidak bertujuan, dan tidak membentuk, nasihat atau cadangan kewangan, pelaburan, dagangan atau jenis lain yang diberikan atau disahkan oleh TradingView. Baca lebih dalam Terma Penggunaan.