FVG, IFVG & Key Liquidity Levels
===============================================================================
FVG · IFVG · KEY LIQUIDITY LEVELS
User guide
===============================================================================
CONTENTS
1. What the indicator does
2. Inputs
3. How to configure the inputs
4. What is drawn on the chart
5. The stats table, column by column
6. Reading the table — a worked example
7. The statistics and how they are calculated
8. Reference figures versus live figures
===============================================================================
1. WHAT THE INDICATOR DOES
===============================================================================
Three things.
FAIR VALUE GAPS AND INVERSIONS, ON UP TO THREE TIMEFRAMES AT ONCE
A fair value gap is found on the higher timeframe's own closed bars. With C the
bar being tested and A the bar two before it:
bullish gap low(C) > high(A)
bearish gap high(C) < low(A)
The middle bar takes no part in the test. The gap is the space between bar A
and bar C.
A gap INVERTS when a later bar on that same timeframe CLOSES through it. A
bullish gap closed below its lower edge stops being support and becomes
resistance — an inverted fair value gap, or IFVG. The zone is then retired
altogether once a later close takes it back the other way.
Each of the three timeframe slots runs independently, so you can watch 5m, 15m
and 1h zones on one chart without changing timeframe.
Nothing repaints. Each slot reads bar [1] — already closed — with lookahead on,
which is the standard non-repainting idiom: history and realtime resolve
identically. A slot asking for a timeframe below the chart's own cannot be
resolved honestly, so it is skipped and a warning label says which.
KEY LIQUIDITY LEVELS, CUT ON THE FUTURES SESSION DAY
Previous day, week, month and year high and low; Asia and London session high
and low; the new day and new week opening gaps; the daily and weekly open; and
daily and weekly VWAP with the previous period's closing value.
Every one of them is cut on the 18:00-to-17:00 ET session day, not midnight to
midnight. A bar at or after 18:00 belongs to the next trade date, so Sunday
18:00 is Monday's session. That single rule drives all of the above.
Because of it, the previous day and week ranges are accumulated from your own
bars rather than requested from a daily or weekly series — those follow the
exchange's session definition and cut in a different place.
A STATISTICS TABLE
Every live zone is listed nearest-first with what it is, how it formed, and
what zones like it have gone on to do on the history your chart has loaded.
===============================================================================
2. INPUTS
===============================================================================
LABELS (ALL OF THEM)
Show labels on master switch for every piece of
text: level labels, VWAP labels and
the captions inside zone boxes
with price off append the price to level labels
Size Small Tiny / Small / Normal / Large / Huge
Level label offset (bars right) 38 how far past the last bar labels sit
GENERAL
Timezone America/New_York
Session day opens at 18:00 or 17:00
FVG / IFVG ENGINE
Enable the engine on
Keep gaps as IFVG once closed through on off deletes them instead
Only display inverted gaps off intact gaps are tracked but hidden
Recolour an inverted gap on paints it with the opposite side's
colour rather than a neutral grey
Box right edge To the current candle
also Fixed length / Infinite right
Box length in HTF bars 6 Fixed length only
Show gap midpoint (CE) off
Write the timeframe on the box on
Box borders on
Minimum gap size (ticks) 0 0 keeps everything
Alert on new gaps / inversions off
FVG TIMEFRAMES
Three rows, each: enable, timeframe, how many to keep, then bullish, bearish
and inverted colours.
TF 1 on 5 keep 12
TF 2 on 15 keep 10
TF 3 off 60 keep 8
PREVIOUS PERIOD HIGH / LOW
Prev day H/L on · Prev week H/L on
Prev month H/L on · Prev year H/L off
Each with its own colour and line style.
Fall back to calendar month / year when history is short on
SESSIONS
Asia H/L on session 1800-0200
London H/L on session 0200-0800
OPENING GAPS (NDOG / NWOG)
New Day Opening Gap on keep 3
New Week Opening Gap on keep 5
Show gap midpoints on
OPENS
Daily open (18:00) on
Weekly open (Sun 18:00) on
VWAP
Source hlc3
Daily VWAP on · Prev day VWAP close on
Weekly VWAP on · Prev week VWAP close off
MOVING AVERAGES
Source close
Plot the averages on the chart on
Wait for the higher-timeframe bar to close on
Three rows, each: type, length, timeframe, enable, colour, width.
MA 1 EMA 20 chart timeframe
MA 2 EMA 50 chart timeframe
MA 3 EMA 200 chart timeframe
Types: SMA EMA WMA RMA HMA DEMA TEMA VWMA ALMA T3 ZLEMA KAMA
MA TYPE-SPECIFIC SETTINGS
ALMA offset 0.85 · ALMA sigma 6.0 · T3 factor 0.7
KAMA fast 2 · KAMA slow 30
Shared by whichever of the three averages use those types.
IMPULSE / DISPLACEMENT
Mark impulse candles on
Impulse threshold (ATR) 1.0
Colour the impulse candles on
Also mark them with a triangle off
LIQUIDITY SWEEPS
Detect key-level sweeps on
Stamp a gap if a sweep happened within this many of its own bars 10
Mark sweeps on the chart off
STATS TABLE
Show the stats table on
Position Top right
Text size Small
Zones to list (nearest first) 6
List inverted gaps only off
Rank SIZE and MOVE against past zones on
Minimum sample before a percentile is shown 40
Number the listed zones on the chart on
Include the moving-average block on
Dark table off
Fall back to NQ reference figures on
Minimum matching zones before figures quoted 15
LEVEL LINES
Line width 1
Extend right (bars) 30
Start each line at its period open on
Fixed start (bars back) 80
===============================================================================
3. HOW TO CONFIGURE THE INPUTS
===============================================================================
START HERE
Set Timezone and Session day opens at first. Everything else is built on them.
18:00 ET suits CME equity index futures. Use 17:00 if your instrument's day
breaks there. On a cash instrument that trades a calendar day, the session-day
machinery still works but the previous day and week levels will not match what
you see elsewhere.
CHOOSING THE FVG TIMEFRAMES
Pick timeframes at or above your chart's. A slot below the chart timeframe is
skipped and a warning label appears; raise the slot or drop to a finer chart.
Two slots is usually enough. A common arrangement is one at your execution
timeframe and one two or three steps above it. The keep count caps how many
zones each slot holds; raise it to see more history, lower it to declutter.
Zones dropped when a slot is full are still recorded in the statistics.
DECLUTTERING
Only display inverted gaps hides intact gaps while still tracking them, so they
appear the moment they invert. Minimum gap size filters out micro gaps. Box
right edge set to Fixed length stops zones running across the whole chart.
LABELS TOO SMALL
Labels (all of them) → Size. It governs level labels and the captions inside
the boxes together.
MOVING AVERAGES ON OTHER TIMEFRAMES
Leave a timeframe blank for the chart's own. Wait for the higher-timeframe bar
to close keeps a higher-timeframe average from repainting its last segment; it
is ignored when the average is on the chart's own timeframe, so a same-
timeframe average is never needlessly lagged.
SWEEPS
A sweep is a bar that trades THROUGH a level and closes back on the side it
came from. Pierce and hold is a break, not a sweep. The window is counted in
the zone's own bars and measured back from the end of the bar that created the
gap, so the displacement candle's own sweep counts.
Sweeps are detected on the CHART timeframe. A level pierced and recovered
inside one 15m bar registers there but may read as a clean break on a 2m chart.
If you care about the SWEPT column being stable, settle on one chart timeframe.
THE STATISTICS
Minimum matching zones controls how specific the match has to be before figures
are quoted. Raise it for firmer numbers and more fallback; lower it for more
specific but noisier ones. Minimum sample before a percentile is shown does the
same job for the SIZE and READ percentiles.
===============================================================================
4. WHAT IS DRAWN ON THE CHART
===============================================================================
ZONE BOXES
One per gap, in its slot's colour. Bullish, bearish and inverted each have
their own colour per slot. With Recolour an inverted gap on, an inverted
bullish gap is painted with the bearish colour, so the colour always shows
which way the zone acts NOW rather than how it was born.
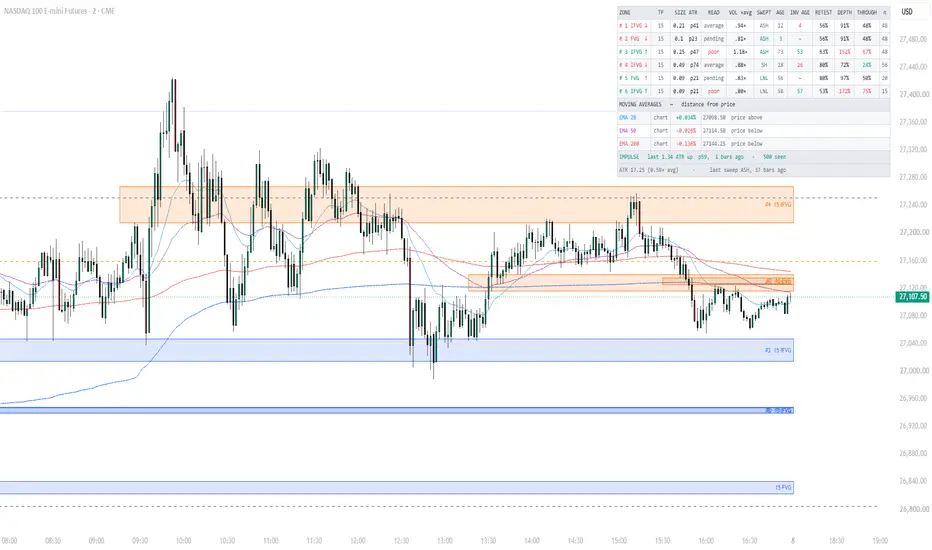
The caption reads, for example, "#1 15 IFVG" — the table row number, the
timeframe, and whether it is intact or inverted. Numbering ties each box to its
row and is re-ranked every bar by distance from price.
By default boxes end at the live candle, so the caption rides the right edge
next to current price.
LEVEL LINES
Previous day, week, month and year high and low; Asia and London high and low;
daily and weekly open; and the previous day and week VWAP closing values. Each
starts at its own period open and extends a configurable distance right, with a
label on the right-hand side.
VWAP CURVES
Daily and weekly VWAP, anchored on the session day and session week. Each
breaks at its anchor rather than drawing a vertical line from the old period's
last value to the new period's first.
OPENING GAP BOXES
The New Day Opening Gap is the space between the 17:00 close and the 18:00
open; the New Week Opening Gap is the same across the weekend. They extend
right from where they formed. Sunday's gap is drawn once, as the NWOG.
MOVING AVERAGES
Up to three, each on its own timeframe.
IMPULSE CANDLES
Any chart candle whose CLOSE travels at least the threshold in ATR from its
OPEN is painted green or red. Body, not range: a long wick that closes back
where it started is not displacement. Triangles are available as an option.
SWEEP MARKERS
Off by default. When on, a small label marks each level taken out and closed
back through.
WARNING LABELS
One if an FVG slot is below the chart timeframe, one if a moving average is.
===============================================================================
5. THE STATS TABLE, COLUMN BY COLUMN
===============================================================================
One row per live zone, nearest to price first.
ZONE
The row number and what the zone is. "IFVG ↓" is an inverted gap now acting
as resistance; "FVG ↑" is an intact bullish gap acting as support. The arrow
is the side it acts on now, so an inverted bullish gap shows ↓.
TF
The timeframe the gap was found on.
SIZE ATR
Height of the zone in ATR of its OWN timeframe, measured when it formed and
frozen there, followed by its percentile against that timeframe's past gaps.
"0.60 p72" is six tenths of an ATR tall and bigger than 72% of them.
READ
A one-word verdict from how hard the close broke through the gap — its
displacement, as a percentile of past breaks on that timeframe.
STRONG p90 and above
fair p70 to p90
average p30 to p70
poor below p30
pending still an intact gap, so nothing has broken it yet
See section 7 for what those bands were worth in testing. Treat it as an
ordering, not an edge.
VOL ×avg
How busy the market was when the zone formed: ATR of its own timeframe at
that moment divided by that ATR's own 100-bar average. 1.00× is normal,
1.50× half again as volatile, 0.60× quiet. Frozen at formation.
SWEPT
A key level traded through and closed back out of shortly before the gap
formed, or a dash. Green when the sweep ran against the gap's own direction —
lows swept, then a bullish gap — which is the sequence most traders mean.
Codes: PDH PDL prev day · PWH PWL prev week · ASH ASL Asia ·
LNH LNL London · SH SL running session.
AGE
Bars of the zone's own timeframe since the three-candle GAP printed. Counts
from birth whether or not it has since inverted.
INV AGE
Bars of the zone's own timeframe since the close that INVERTED it — how long
it has existed as an IFVG rather than as a gap. A dash means it has not
inverted. AGE and INV AGE differ by however long the gap sat before being
broken, which is often hours.
The last four columns are different in kind. They do not describe the zone on
that row. They describe PAST zones, on the history your chart has loaded, that
formed with the same setup as it.
RETEST
The share of those past zones that price came back to at all.
DEPTH
Median depth of their FIRST retest, as a percent of the zone's own height.
40% means price pushed four tenths of the way in and left again. 100% means
it reached the far edge. Above 100% means it went through. Lower means that
kind of zone was rejected harder.
THROUGH
The share of those first retests that carried clean out the far side. This is
the rejection rate inverted.
n
How many past zones matched. "ref" means too few so far, and the three
figures to its left are reference values rather than measured ones — see
section 8. Hover any of them to see how many matched and on what.
MOVING AVERAGES BLOCK
Below the zones, one row per enabled average: type and length, its timeframe,
the distance from price as a percent, the average's value, and whether price
is above or below.
FOOTER
Chart ATR against its own 100-bar average, and the most recent key-level
sweep with how many bars ago it happened. Both describe the chart, not any
one zone.
===============================================================================
6. READING THE TABLE — A WORKED EXAMPLE
===============================================================================
ZONE TF SIZE ATR READ VOL ×avg SWEPT AGE INV AGE RETEST DEPTH THROUGH n
#1 IFVG ↓ 15 0.61 p78 STRONG 1.42× ASL 34 6 93% 44% 34% 58
#2 FVG ↑ 5 0.10 p23 pending 0.81× – 3 – ·96% ·67% ·48% ref
ROW 1, read left to right.
A 15-minute zone, sixth-nearest to nothing — it is listed first, so price is
closer to it than to any other live zone. It is an inverted gap now acting as
resistance, so price is below it and would have to rise to reach it.
It is 0.61 ATR tall, bigger than 78% of 15m gaps on this chart — a reasonably
chunky zone, so there is room between its edges.
READ says STRONG: the close that broke the original gap went more than nine
tenths of the way through the distribution of past breaks. The break was
decisive.
It formed when 15m ATR was 1.42× its own average, so in a fast stretch. That
also means its SIZE and the move that made it were measured against a wider
ruler than usual.
ASL in SWEPT: the Asia session low was taken out and recovered shortly before
the gap formed. It is green, so that sweep ran against the gap's direction —
lows swept, then an upward gap, which then inverted.
The gap printed 34 bars ago and has been an IFVG for the last 6. It sat as an
intact gap for 28 bars before being broken.
The last four columns step outside this zone. Of past 15m zones on this chart
that formed with the same size tercile, the same swept level and the same
distance to a key level: 93% were retested, the typical first retest pushed 44%
of the way in, and 34% carried clean through. 58 of them matched, and the
figure is not dotted, so these are this chart's own numbers.
A practical read: this zone has rejected roughly two thirds of the time
historically, and when it has held, price has typically turned before reaching
halfway in. That argues for working an entry nearer the proximal edge than the
middle, and for not treating a 44% penetration as a failure.
ROW 2 is a different case. It is an intact 5m gap — READ says pending because
nothing has broken it, and INV AGE is a dash for the same reason. Its last four
figures carry a leading dot and n reads "ref", so they are reference values
rather than measured ones: this chart has not yet accumulated enough comparable
5m zones. Treat them as a placeholder.
WHAT THE TABLE DOES NOT TELL YOU
Nothing here predicts direction. DEPTH and THROUGH describe whether a zone of
this kind tends to be rejected or run through — not which way price goes
afterwards. In testing, the favourable-versus-adverse split barely moved across
any of these groupings.
===============================================================================
7. THE STATISTICS AND HOW THEY ARE CALCULATED
===============================================================================
WHAT COUNTS AS A RETEST
When a zone inverts, its near edge becomes whichever side price must come back
to. Tracking starts on the next bar of the ZONE'S OWN timeframe — not the
chart's. This matters: reading penetration off chart bars made every figure
depend on which chart you happened to be viewing, because one coarse candle can
span an entire zone and record a deep push where a finer chart would have seen
price stall at a third of the way in.
The bar that creates a zone, and the bar that inverts one, are both skipped.
Each passes through the zone by construction, and counting either as a retest
would mark every zone touched the instant it appeared.
DEPTH
Penetration is measured in zone heights from the near edge: 0 at the near edge,
1 at the far edge, above 1 once price is through. The figure recorded is the
deepest point of the FIRST visit — from the touch until price leaves the zone
again — expressed as a percent.
Measuring over a longer window answers a different and useless question. Over a
whole session the median reaches roughly twenty zone heights, because price
eventually goes everywhere.
THROUGH
The share of first visits whose depth reached 1.00 or more.
RETEST
The share of recorded zones that were touched at all. A zone is recorded once,
at the earlier of its first visit ending or the zone being removed. Recording
on removal matters: a zone price closes straight through is deleted on the
spot, and those are precisely the ones that went through. Without it the pool
would contain only survivors.
HOW A ROW IS MATCHED TO PAST ZONES
The match is on four attributes: timeframe slot, size tercile, level swept
before forming, and distance band to the nearest key level.
Exact four-way matches run out quickly, so when fewer than the minimum have
matched the test is loosened one attribute at a time, least informative first:
swept level, then size, then distance. The timeframe is always held. The
tooltip on each cell names the tier that was actually used, so a figure is
never presented as more specific than it is.
DISTANCE BANDS
Measured from the zone to the nearest of: previous day and week high and low,
daily and weekly VWAP, and Asia and London high and low. A level inside the
zone scores zero.
band 0 a level inside the zone
band 1 within 0.02% of price
band 2 0.02% to 0.06%
band 3 0.06% to 0.15%
band 4 beyond 0.15%
THE PERCENTILES IN SIZE AND READ
Each timeframe keeps a rolling record of its own last 500 gap sizes and 500
break displacements. A percentile is that zone's value against that record, so
"big" and "small" mean something relative to the instrument rather than a fixed
number. Below the minimum sample no percentile is shown.
WHAT THE RESEARCH BEHIND THIS FOUND
From 261,256 inverted gaps on NQ 5m and 15m, 2010 to 2025:
Proximity to a key level is the one large, consistent effect. Median first-visit
depth ran 42% with a level inside the zone against 158% when the nearest was
beyond 0.15%, and the through-rate 37% to 60%, monotonically across 191,000
retests. This is what the reference figures encode.
Displacement — the READ column — orders outcomes but weakly. Out of sample,
reaching +1 ATR before −1 ATR ran 52.0% for p90+, 50.8% fair, 50.5% average and
49.4% poor. A control zone placed at random near the same impulse scored 50.4%
in the top band. At a 1:1 stop and target, 52% is roughly break-even after
costs. Treat READ as an ordering, not an edge.
Gap size did not predict anything. The largest and smallest fifths both won
about 52% of the time out of sample.
Volatility regime at formation did not predict anything either. The quietest
fifth won 51.2%, the busiest 52.9%, with the gap over a control flat across
every band.
Direction is the honest gap in all of this. Proximity governs whether a zone is
rejected; the favourable-versus-adverse split stayed near 50% across every
grouping tested.
===============================================================================
8. REFERENCE FIGURES VERSUS LIVE FIGURES
===============================================================================
RETEST, DEPTH and THROUGH are measured from your own chart. That is deliberate:
these are habits of an instrument, and freezing one instrument's numbers into
the indicator would give them false authority everywhere else.
The cost is that they start empty and build slowly. A zone has to invert, be
retested, and have that visit end before it joins the pool.
So until a row has enough matches of its own, it shows reference figures
instead, marked with a leading dot and with n reading "ref":
·96% ·67% ·48% ref reference — NQ, not this chart
93% 44% 34% 58 measured here, 58 matching zones
Reference values are dimmed. Measured ones get the normal colour coding —
green where depth and through-rate are low, red where they are high.
WHAT THE REFERENCE IS
261,256 inverted gaps on NQ, June 2010 to March 2025, grouped by distance band
alone — not by size or swept level, because those groupings were not strong
enough to justify freezing. Separate tables for 5m and 15m; a slot on any other
timeframe uses the nearer of the two, which is an approximation, and the dot is
the warning.
5-minute retest depth through
level inside 95.3% 42% 37.5%
within 0.02% 96.0% 67% 47.5%
0.02 to 0.06% 95.7% 100% 50.2%
0.06 to 0.15% 94.3% 117% 55.5%
beyond 0.15% 92.5% 158% 59.9%
15-minute retest depth through
level inside 91.4% 30% 31.6%
within 0.02% 92.9% 67% 46.3%
0.02 to 0.06% 91.9% 79% 48.0%
0.06 to 0.15% 89.9% 100% 50.6%
beyond 0.15% 87.0% 120% 54.3%
WHICH TO TRUST
A dotted figure is a placeholder. An undotted one is yours, and once n is into
the dozens it is the better guide — it reflects your instrument, your session
and your current regime.
Turn the fallback off if you would rather see dashes than another instrument's
numbers.
WHAT STILL VARIES WITH YOUR CHART
Depth and retest detection are now on each zone's own timeframe, so a 15m zone
reads the same whether you view it on 2m or 15m. Two things still move:
- how much history TradingView loads, which sets how many zones are in the
pool and therefore the medians
- sweep detection, which runs on the chart timeframe and can change the
SWEPT value and therefore what a row matches against
The n column is the guide throughout. A small n, or a tooltip saying the match
was loosened, means the figures are soft.
===============================================================================
No part of this is financial advice. The statistics describe what has happened,
on one instrument or on your loaded history. They are not predictions.
===============================================================================
FVG · IFVG · KEY LIQUIDITY LEVELS
User guide
===============================================================================
CONTENTS
1. What the indicator does
2. Inputs
3. How to configure the inputs
4. What is drawn on the chart
5. The stats table, column by column
6. Reading the table — a worked example
7. The statistics and how they are calculated
8. Reference figures versus live figures
===============================================================================
1. WHAT THE INDICATOR DOES
===============================================================================
Three things.
FAIR VALUE GAPS AND INVERSIONS, ON UP TO THREE TIMEFRAMES AT ONCE
A fair value gap is found on the higher timeframe's own closed bars. With C the
bar being tested and A the bar two before it:
bullish gap low(C) > high(A)
bearish gap high(C) < low(A)
The middle bar takes no part in the test. The gap is the space between bar A
and bar C.
A gap INVERTS when a later bar on that same timeframe CLOSES through it. A
bullish gap closed below its lower edge stops being support and becomes
resistance — an inverted fair value gap, or IFVG. The zone is then retired
altogether once a later close takes it back the other way.
Each of the three timeframe slots runs independently, so you can watch 5m, 15m
and 1h zones on one chart without changing timeframe.
Nothing repaints. Each slot reads bar [1] — already closed — with lookahead on,
which is the standard non-repainting idiom: history and realtime resolve
identically. A slot asking for a timeframe below the chart's own cannot be
resolved honestly, so it is skipped and a warning label says which.
KEY LIQUIDITY LEVELS, CUT ON THE FUTURES SESSION DAY
Previous day, week, month and year high and low; Asia and London session high
and low; the new day and new week opening gaps; the daily and weekly open; and
daily and weekly VWAP with the previous period's closing value.
Every one of them is cut on the 18:00-to-17:00 ET session day, not midnight to
midnight. A bar at or after 18:00 belongs to the next trade date, so Sunday
18:00 is Monday's session. That single rule drives all of the above.
Because of it, the previous day and week ranges are accumulated from your own
bars rather than requested from a daily or weekly series — those follow the
exchange's session definition and cut in a different place.
A STATISTICS TABLE
Every live zone is listed nearest-first with what it is, how it formed, and
what zones like it have gone on to do on the history your chart has loaded.
===============================================================================
2. INPUTS
===============================================================================
LABELS (ALL OF THEM)
Show labels on master switch for every piece of
text: level labels, VWAP labels and
the captions inside zone boxes
with price off append the price to level labels
Size Small Tiny / Small / Normal / Large / Huge
Level label offset (bars right) 38 how far past the last bar labels sit
GENERAL
Timezone America/New_York
Session day opens at 18:00 or 17:00
FVG / IFVG ENGINE
Enable the engine on
Keep gaps as IFVG once closed through on off deletes them instead
Only display inverted gaps off intact gaps are tracked but hidden
Recolour an inverted gap on paints it with the opposite side's
colour rather than a neutral grey
Box right edge To the current candle
also Fixed length / Infinite right
Box length in HTF bars 6 Fixed length only
Show gap midpoint (CE) off
Write the timeframe on the box on
Box borders on
Minimum gap size (ticks) 0 0 keeps everything
Alert on new gaps / inversions off
FVG TIMEFRAMES
Three rows, each: enable, timeframe, how many to keep, then bullish, bearish
and inverted colours.
TF 1 on 5 keep 12
TF 2 on 15 keep 10
TF 3 off 60 keep 8
PREVIOUS PERIOD HIGH / LOW
Prev day H/L on · Prev week H/L on
Prev month H/L on · Prev year H/L off
Each with its own colour and line style.
Fall back to calendar month / year when history is short on
SESSIONS
Asia H/L on session 1800-0200
London H/L on session 0200-0800
OPENING GAPS (NDOG / NWOG)
New Day Opening Gap on keep 3
New Week Opening Gap on keep 5
Show gap midpoints on
OPENS
Daily open (18:00) on
Weekly open (Sun 18:00) on
VWAP
Source hlc3
Daily VWAP on · Prev day VWAP close on
Weekly VWAP on · Prev week VWAP close off
MOVING AVERAGES
Source close
Plot the averages on the chart on
Wait for the higher-timeframe bar to close on
Three rows, each: type, length, timeframe, enable, colour, width.
MA 1 EMA 20 chart timeframe
MA 2 EMA 50 chart timeframe
MA 3 EMA 200 chart timeframe
Types: SMA EMA WMA RMA HMA DEMA TEMA VWMA ALMA T3 ZLEMA KAMA
MA TYPE-SPECIFIC SETTINGS
ALMA offset 0.85 · ALMA sigma 6.0 · T3 factor 0.7
KAMA fast 2 · KAMA slow 30
Shared by whichever of the three averages use those types.
IMPULSE / DISPLACEMENT
Mark impulse candles on
Impulse threshold (ATR) 1.0
Colour the impulse candles on
Also mark them with a triangle off
LIQUIDITY SWEEPS
Detect key-level sweeps on
Stamp a gap if a sweep happened within this many of its own bars 10
Mark sweeps on the chart off
STATS TABLE
Show the stats table on
Position Top right
Text size Small
Zones to list (nearest first) 6
List inverted gaps only off
Rank SIZE and MOVE against past zones on
Minimum sample before a percentile is shown 40
Number the listed zones on the chart on
Include the moving-average block on
Dark table off
Fall back to NQ reference figures on
Minimum matching zones before figures quoted 15
LEVEL LINES
Line width 1
Extend right (bars) 30
Start each line at its period open on
Fixed start (bars back) 80
===============================================================================
3. HOW TO CONFIGURE THE INPUTS
===============================================================================
START HERE
Set Timezone and Session day opens at first. Everything else is built on them.
18:00 ET suits CME equity index futures. Use 17:00 if your instrument's day
breaks there. On a cash instrument that trades a calendar day, the session-day
machinery still works but the previous day and week levels will not match what
you see elsewhere.
CHOOSING THE FVG TIMEFRAMES
Pick timeframes at or above your chart's. A slot below the chart timeframe is
skipped and a warning label appears; raise the slot or drop to a finer chart.
Two slots is usually enough. A common arrangement is one at your execution
timeframe and one two or three steps above it. The keep count caps how many
zones each slot holds; raise it to see more history, lower it to declutter.
Zones dropped when a slot is full are still recorded in the statistics.
DECLUTTERING
Only display inverted gaps hides intact gaps while still tracking them, so they
appear the moment they invert. Minimum gap size filters out micro gaps. Box
right edge set to Fixed length stops zones running across the whole chart.
LABELS TOO SMALL
Labels (all of them) → Size. It governs level labels and the captions inside
the boxes together.
MOVING AVERAGES ON OTHER TIMEFRAMES
Leave a timeframe blank for the chart's own. Wait for the higher-timeframe bar
to close keeps a higher-timeframe average from repainting its last segment; it
is ignored when the average is on the chart's own timeframe, so a same-
timeframe average is never needlessly lagged.
SWEEPS
A sweep is a bar that trades THROUGH a level and closes back on the side it
came from. Pierce and hold is a break, not a sweep. The window is counted in
the zone's own bars and measured back from the end of the bar that created the
gap, so the displacement candle's own sweep counts.
Sweeps are detected on the CHART timeframe. A level pierced and recovered
inside one 15m bar registers there but may read as a clean break on a 2m chart.
If you care about the SWEPT column being stable, settle on one chart timeframe.
THE STATISTICS
Minimum matching zones controls how specific the match has to be before figures
are quoted. Raise it for firmer numbers and more fallback; lower it for more
specific but noisier ones. Minimum sample before a percentile is shown does the
same job for the SIZE and READ percentiles.
===============================================================================
4. WHAT IS DRAWN ON THE CHART
===============================================================================
ZONE BOXES
One per gap, in its slot's colour. Bullish, bearish and inverted each have
their own colour per slot. With Recolour an inverted gap on, an inverted
bullish gap is painted with the bearish colour, so the colour always shows
which way the zone acts NOW rather than how it was born.
The caption reads, for example, "#1 15 IFVG" — the table row number, the
timeframe, and whether it is intact or inverted. Numbering ties each box to its
row and is re-ranked every bar by distance from price.
By default boxes end at the live candle, so the caption rides the right edge
next to current price.
LEVEL LINES
Previous day, week, month and year high and low; Asia and London high and low;
daily and weekly open; and the previous day and week VWAP closing values. Each
starts at its own period open and extends a configurable distance right, with a
label on the right-hand side.
VWAP CURVES
Daily and weekly VWAP, anchored on the session day and session week. Each
breaks at its anchor rather than drawing a vertical line from the old period's
last value to the new period's first.
OPENING GAP BOXES
The New Day Opening Gap is the space between the 17:00 close and the 18:00
open; the New Week Opening Gap is the same across the weekend. They extend
right from where they formed. Sunday's gap is drawn once, as the NWOG.
MOVING AVERAGES
Up to three, each on its own timeframe.
IMPULSE CANDLES
Any chart candle whose CLOSE travels at least the threshold in ATR from its
OPEN is painted green or red. Body, not range: a long wick that closes back
where it started is not displacement. Triangles are available as an option.
SWEEP MARKERS
Off by default. When on, a small label marks each level taken out and closed
back through.
WARNING LABELS
One if an FVG slot is below the chart timeframe, one if a moving average is.
===============================================================================
5. THE STATS TABLE, COLUMN BY COLUMN
===============================================================================
One row per live zone, nearest to price first.
ZONE
The row number and what the zone is. "IFVG ↓" is an inverted gap now acting
as resistance; "FVG ↑" is an intact bullish gap acting as support. The arrow
is the side it acts on now, so an inverted bullish gap shows ↓.
TF
The timeframe the gap was found on.
SIZE ATR
Height of the zone in ATR of its OWN timeframe, measured when it formed and
frozen there, followed by its percentile against that timeframe's past gaps.
"0.60 p72" is six tenths of an ATR tall and bigger than 72% of them.
READ
A one-word verdict from how hard the close broke through the gap — its
displacement, as a percentile of past breaks on that timeframe.
STRONG p90 and above
fair p70 to p90
average p30 to p70
poor below p30
pending still an intact gap, so nothing has broken it yet
See section 7 for what those bands were worth in testing. Treat it as an
ordering, not an edge.
VOL ×avg
How busy the market was when the zone formed: ATR of its own timeframe at
that moment divided by that ATR's own 100-bar average. 1.00× is normal,
1.50× half again as volatile, 0.60× quiet. Frozen at formation.
SWEPT
A key level traded through and closed back out of shortly before the gap
formed, or a dash. Green when the sweep ran against the gap's own direction —
lows swept, then a bullish gap — which is the sequence most traders mean.
Codes: PDH PDL prev day · PWH PWL prev week · ASH ASL Asia ·
LNH LNL London · SH SL running session.
AGE
Bars of the zone's own timeframe since the three-candle GAP printed. Counts
from birth whether or not it has since inverted.
INV AGE
Bars of the zone's own timeframe since the close that INVERTED it — how long
it has existed as an IFVG rather than as a gap. A dash means it has not
inverted. AGE and INV AGE differ by however long the gap sat before being
broken, which is often hours.
The last four columns are different in kind. They do not describe the zone on
that row. They describe PAST zones, on the history your chart has loaded, that
formed with the same setup as it.
RETEST
The share of those past zones that price came back to at all.
DEPTH
Median depth of their FIRST retest, as a percent of the zone's own height.
40% means price pushed four tenths of the way in and left again. 100% means
it reached the far edge. Above 100% means it went through. Lower means that
kind of zone was rejected harder.
THROUGH
The share of those first retests that carried clean out the far side. This is
the rejection rate inverted.
n
How many past zones matched. "ref" means too few so far, and the three
figures to its left are reference values rather than measured ones — see
section 8. Hover any of them to see how many matched and on what.
MOVING AVERAGES BLOCK
Below the zones, one row per enabled average: type and length, its timeframe,
the distance from price as a percent, the average's value, and whether price
is above or below.
FOOTER
Chart ATR against its own 100-bar average, and the most recent key-level
sweep with how many bars ago it happened. Both describe the chart, not any
one zone.
===============================================================================
6. READING THE TABLE — A WORKED EXAMPLE
===============================================================================
ZONE TF SIZE ATR READ VOL ×avg SWEPT AGE INV AGE RETEST DEPTH THROUGH n
#1 IFVG ↓ 15 0.61 p78 STRONG 1.42× ASL 34 6 93% 44% 34% 58
#2 FVG ↑ 5 0.10 p23 pending 0.81× – 3 – ·96% ·67% ·48% ref
ROW 1, read left to right.
A 15-minute zone, sixth-nearest to nothing — it is listed first, so price is
closer to it than to any other live zone. It is an inverted gap now acting as
resistance, so price is below it and would have to rise to reach it.
It is 0.61 ATR tall, bigger than 78% of 15m gaps on this chart — a reasonably
chunky zone, so there is room between its edges.
READ says STRONG: the close that broke the original gap went more than nine
tenths of the way through the distribution of past breaks. The break was
decisive.
It formed when 15m ATR was 1.42× its own average, so in a fast stretch. That
also means its SIZE and the move that made it were measured against a wider
ruler than usual.
ASL in SWEPT: the Asia session low was taken out and recovered shortly before
the gap formed. It is green, so that sweep ran against the gap's direction —
lows swept, then an upward gap, which then inverted.
The gap printed 34 bars ago and has been an IFVG for the last 6. It sat as an
intact gap for 28 bars before being broken.
The last four columns step outside this zone. Of past 15m zones on this chart
that formed with the same size tercile, the same swept level and the same
distance to a key level: 93% were retested, the typical first retest pushed 44%
of the way in, and 34% carried clean through. 58 of them matched, and the
figure is not dotted, so these are this chart's own numbers.
A practical read: this zone has rejected roughly two thirds of the time
historically, and when it has held, price has typically turned before reaching
halfway in. That argues for working an entry nearer the proximal edge than the
middle, and for not treating a 44% penetration as a failure.
ROW 2 is a different case. It is an intact 5m gap — READ says pending because
nothing has broken it, and INV AGE is a dash for the same reason. Its last four
figures carry a leading dot and n reads "ref", so they are reference values
rather than measured ones: this chart has not yet accumulated enough comparable
5m zones. Treat them as a placeholder.
WHAT THE TABLE DOES NOT TELL YOU
Nothing here predicts direction. DEPTH and THROUGH describe whether a zone of
this kind tends to be rejected or run through — not which way price goes
afterwards. In testing, the favourable-versus-adverse split barely moved across
any of these groupings.
===============================================================================
7. THE STATISTICS AND HOW THEY ARE CALCULATED
===============================================================================
WHAT COUNTS AS A RETEST
When a zone inverts, its near edge becomes whichever side price must come back
to. Tracking starts on the next bar of the ZONE'S OWN timeframe — not the
chart's. This matters: reading penetration off chart bars made every figure
depend on which chart you happened to be viewing, because one coarse candle can
span an entire zone and record a deep push where a finer chart would have seen
price stall at a third of the way in.
The bar that creates a zone, and the bar that inverts one, are both skipped.
Each passes through the zone by construction, and counting either as a retest
would mark every zone touched the instant it appeared.
DEPTH
Penetration is measured in zone heights from the near edge: 0 at the near edge,
1 at the far edge, above 1 once price is through. The figure recorded is the
deepest point of the FIRST visit — from the touch until price leaves the zone
again — expressed as a percent.
Measuring over a longer window answers a different and useless question. Over a
whole session the median reaches roughly twenty zone heights, because price
eventually goes everywhere.
THROUGH
The share of first visits whose depth reached 1.00 or more.
RETEST
The share of recorded zones that were touched at all. A zone is recorded once,
at the earlier of its first visit ending or the zone being removed. Recording
on removal matters: a zone price closes straight through is deleted on the
spot, and those are precisely the ones that went through. Without it the pool
would contain only survivors.
HOW A ROW IS MATCHED TO PAST ZONES
The match is on four attributes: timeframe slot, size tercile, level swept
before forming, and distance band to the nearest key level.
Exact four-way matches run out quickly, so when fewer than the minimum have
matched the test is loosened one attribute at a time, least informative first:
swept level, then size, then distance. The timeframe is always held. The
tooltip on each cell names the tier that was actually used, so a figure is
never presented as more specific than it is.
DISTANCE BANDS
Measured from the zone to the nearest of: previous day and week high and low,
daily and weekly VWAP, and Asia and London high and low. A level inside the
zone scores zero.
band 0 a level inside the zone
band 1 within 0.02% of price
band 2 0.02% to 0.06%
band 3 0.06% to 0.15%
band 4 beyond 0.15%
THE PERCENTILES IN SIZE AND READ
Each timeframe keeps a rolling record of its own last 500 gap sizes and 500
break displacements. A percentile is that zone's value against that record, so
"big" and "small" mean something relative to the instrument rather than a fixed
number. Below the minimum sample no percentile is shown.
WHAT THE RESEARCH BEHIND THIS FOUND
From 261,256 inverted gaps on NQ 5m and 15m, 2010 to 2025:
Proximity to a key level is the one large, consistent effect. Median first-visit
depth ran 42% with a level inside the zone against 158% when the nearest was
beyond 0.15%, and the through-rate 37% to 60%, monotonically across 191,000
retests. This is what the reference figures encode.
Displacement — the READ column — orders outcomes but weakly. Out of sample,
reaching +1 ATR before −1 ATR ran 52.0% for p90+, 50.8% fair, 50.5% average and
49.4% poor. A control zone placed at random near the same impulse scored 50.4%
in the top band. At a 1:1 stop and target, 52% is roughly break-even after
costs. Treat READ as an ordering, not an edge.
Gap size did not predict anything. The largest and smallest fifths both won
about 52% of the time out of sample.
Volatility regime at formation did not predict anything either. The quietest
fifth won 51.2%, the busiest 52.9%, with the gap over a control flat across
every band.
Direction is the honest gap in all of this. Proximity governs whether a zone is
rejected; the favourable-versus-adverse split stayed near 50% across every
grouping tested.
===============================================================================
8. REFERENCE FIGURES VERSUS LIVE FIGURES
===============================================================================
RETEST, DEPTH and THROUGH are measured from your own chart. That is deliberate:
these are habits of an instrument, and freezing one instrument's numbers into
the indicator would give them false authority everywhere else.
The cost is that they start empty and build slowly. A zone has to invert, be
retested, and have that visit end before it joins the pool.
So until a row has enough matches of its own, it shows reference figures
instead, marked with a leading dot and with n reading "ref":
·96% ·67% ·48% ref reference — NQ, not this chart
93% 44% 34% 58 measured here, 58 matching zones
Reference values are dimmed. Measured ones get the normal colour coding —
green where depth and through-rate are low, red where they are high.
WHAT THE REFERENCE IS
261,256 inverted gaps on NQ, June 2010 to March 2025, grouped by distance band
alone — not by size or swept level, because those groupings were not strong
enough to justify freezing. Separate tables for 5m and 15m; a slot on any other
timeframe uses the nearer of the two, which is an approximation, and the dot is
the warning.
5-minute retest depth through
level inside 95.3% 42% 37.5%
within 0.02% 96.0% 67% 47.5%
0.02 to 0.06% 95.7% 100% 50.2%
0.06 to 0.15% 94.3% 117% 55.5%
beyond 0.15% 92.5% 158% 59.9%
15-minute retest depth through
level inside 91.4% 30% 31.6%
within 0.02% 92.9% 67% 46.3%
0.02 to 0.06% 91.9% 79% 48.0%
0.06 to 0.15% 89.9% 100% 50.6%
beyond 0.15% 87.0% 120% 54.3%
WHICH TO TRUST
A dotted figure is a placeholder. An undotted one is yours, and once n is into
the dozens it is the better guide — it reflects your instrument, your session
and your current regime.
Turn the fallback off if you would rather see dashes than another instrument's
numbers.
WHAT STILL VARIES WITH YOUR CHART
Depth and retest detection are now on each zone's own timeframe, so a 15m zone
reads the same whether you view it on 2m or 15m. Two things still move:
- how much history TradingView loads, which sets how many zones are in the
pool and therefore the medians
- sweep detection, which runs on the chart timeframe and can change the
SWEPT value and therefore what a row matches against
The n column is the guide throughout. A small n, or a tooltip saying the match
was loosened, means the figures are soft.
===============================================================================
No part of this is financial advice. The statistics describe what has happened,
on one instrument or on your loaded history. They are not predictions.
===============================================================================

Penafian
Maklumat dan penerbitan adalah tidak bertujuan, dan tidak membentuk, nasihat atau cadangan kewangan, pelaburan, dagangan atau jenis lain yang diberikan atau disahkan oleh TradingView. Baca lebih dalam Terma Penggunaan.
Penafian
Maklumat dan penerbitan adalah tidak bertujuan, dan tidak membentuk, nasihat atau cadangan kewangan, pelaburan, dagangan atau jenis lain yang diberikan atau disahkan oleh TradingView. Baca lebih dalam Terma Penggunaan.