OPEN-SOURCE SCRIPT
Telah dikemas kini Bollinger Bands Gradient [Gabremoku]
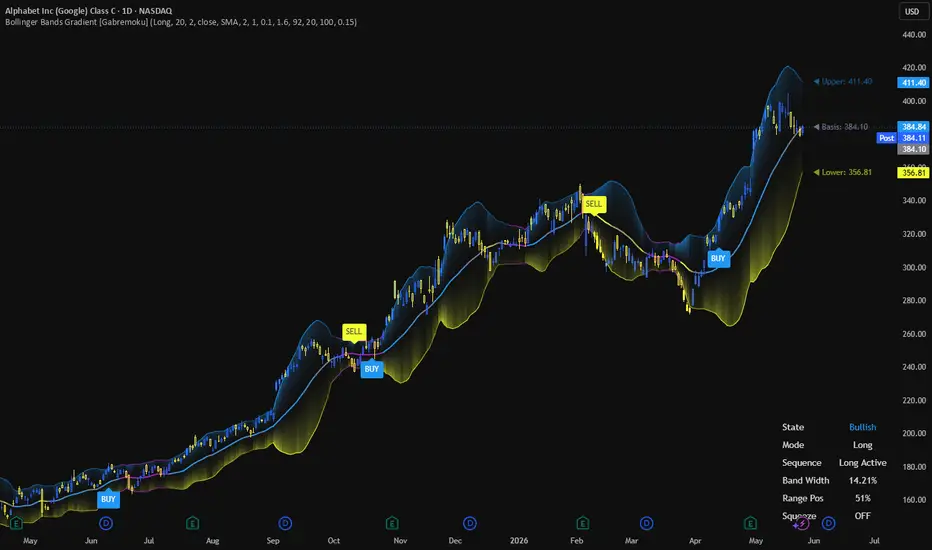
Bollinger Bands Gradient [Gabremoku] is an enhanced Bollinger Band overlay designed to turn classic volatility bands into a richer visual and signal-based trading framework.
The indicator keeps the core structure of Bollinger Bands — Upper Band, Basis, and Lower Band — but adds a dynamic gradient fill, squeeze detection, state-based bar coloring, strategy-side signal logic, and an optional dashboard for fast chart interpretation. Bollinger Bands are widely used to read volatility compression, expansion, and breakout behavior, especially when traders want more context than a standard three-line display can offer.
This script is built for traders who want Bollinger Bands to feel more alive: clearer transitions, better volatility awareness, and cleaner breakout mapping directly on price.
What it shows
🌈 Dynamic Gradient Fill — the area between Upper/Basis and Basis/Lower is filled with adaptive color intensity that changes according to price distance from the basis.
🗜️ Squeeze Detection — the script monitors Bollinger Band compression and flags low-volatility states when band width contracts relative to its recent range. Bollinger squeezes are commonly used to identify volatility contraction before a possible breakout.
🎨 State-Based Coloring — basis line, bands, bars, and optional background can all shift visually depending on whether the market is bullish, bearish, neutral, or in squeeze mode.
📍 Breakout Signals — optional labels for:
BUY / SELL in Long mode
SHORT / CLOSE in Short mode
🪧 Dashboard — a compact panel showing current state, strategy mode, sequence status, band width, range position, and squeeze condition.
🏷️ Last Value Labels — optional live labels for Upper, Basis, and Lower band values.
Core logic
This script combines volatility structure and signal sequence control.
At the core, Bollinger Bands define the dynamic range around a moving average using standard deviation, which helps visualize whether price is relatively stretched or compressed versus its recent behavior. Narrow bands usually reflect low volatility, while wide bands reflect expansion.
On top of that, this version introduces:
a basis color gradient tied to price position inside the band structure,
a fill intensity model tied to distance from the basis,
and a state machine that prevents repeated entry signals in the same sequence.
That makes the indicator more structured than a plain breakout marker, especially for traders who want cleaner signal flow.
Signal logic
The indicator supports two operating modes:
Long Mode
BUY = breakout above the Upper Band
SELL = breakdown below the Lower Band
Short Mode
SHORT = breakdown below the Lower Band
CLOSE = breakout above the Upper Band
This logic reflects one of the most common ways traders use Bollinger Bands: watching for volatility compression, then responding to expansion outside the bands. At the same time, Bollinger-based strategies can also be used for mean reversion, which is why breakout signals generally work best when confirmed by price structure, momentum, or volume.
Features
✅ Classic Bollinger Bands with selectable basis type
✅ Dynamic gradient fill above and below the basis
✅ Adaptive basis coloring based on price position
✅ Squeeze detection using band-width normalization
✅ Optional squeeze background highlighting
✅ Optional bar coloring by state
✅ Strategy-side selector: Long or Short
✅ Breakout signal state machine
✅ BUY / SELL / SHORT / CLOSE labels
✅ On-chart dashboard
✅ Optional last-value labels
✅ Fully customizable colors and style inputs
How to use
A practical reading flow is:
Watch for band contraction and squeeze conditions.
Treat that as a volatility compression phase.
Monitor for price expansion outside the bands.
Use the selected strategy mode to interpret the resulting signal sequence.
In practice:
tight bands + squeeze on = market compression
break above upper band = bullish expansion candidate
break below lower band = bearish expansion candidate
That said, Bollinger breakouts can fail in choppy environments, so many traders confirm them with momentum, volume, or higher timeframe structure rather than using them in isolation.
Notes
This indicator is designed as an enhanced Bollinger workflow tool, not as a complete trading system with full risk management. Bollinger Bands can support both breakout and mean-reversion approaches, so the best interpretation depends on market regime and confirmation methods.
Author: Gabremoku
Pine Script v6
The indicator keeps the core structure of Bollinger Bands — Upper Band, Basis, and Lower Band — but adds a dynamic gradient fill, squeeze detection, state-based bar coloring, strategy-side signal logic, and an optional dashboard for fast chart interpretation. Bollinger Bands are widely used to read volatility compression, expansion, and breakout behavior, especially when traders want more context than a standard three-line display can offer.
This script is built for traders who want Bollinger Bands to feel more alive: clearer transitions, better volatility awareness, and cleaner breakout mapping directly on price.
What it shows
🌈 Dynamic Gradient Fill — the area between Upper/Basis and Basis/Lower is filled with adaptive color intensity that changes according to price distance from the basis.
🗜️ Squeeze Detection — the script monitors Bollinger Band compression and flags low-volatility states when band width contracts relative to its recent range. Bollinger squeezes are commonly used to identify volatility contraction before a possible breakout.
🎨 State-Based Coloring — basis line, bands, bars, and optional background can all shift visually depending on whether the market is bullish, bearish, neutral, or in squeeze mode.
📍 Breakout Signals — optional labels for:
BUY / SELL in Long mode
SHORT / CLOSE in Short mode
🪧 Dashboard — a compact panel showing current state, strategy mode, sequence status, band width, range position, and squeeze condition.
🏷️ Last Value Labels — optional live labels for Upper, Basis, and Lower band values.
Core logic
This script combines volatility structure and signal sequence control.
At the core, Bollinger Bands define the dynamic range around a moving average using standard deviation, which helps visualize whether price is relatively stretched or compressed versus its recent behavior. Narrow bands usually reflect low volatility, while wide bands reflect expansion.
On top of that, this version introduces:
a basis color gradient tied to price position inside the band structure,
a fill intensity model tied to distance from the basis,
and a state machine that prevents repeated entry signals in the same sequence.
That makes the indicator more structured than a plain breakout marker, especially for traders who want cleaner signal flow.
Signal logic
The indicator supports two operating modes:
Long Mode
BUY = breakout above the Upper Band
SELL = breakdown below the Lower Band
Short Mode
SHORT = breakdown below the Lower Band
CLOSE = breakout above the Upper Band
This logic reflects one of the most common ways traders use Bollinger Bands: watching for volatility compression, then responding to expansion outside the bands. At the same time, Bollinger-based strategies can also be used for mean reversion, which is why breakout signals generally work best when confirmed by price structure, momentum, or volume.
Features
✅ Classic Bollinger Bands with selectable basis type
✅ Dynamic gradient fill above and below the basis
✅ Adaptive basis coloring based on price position
✅ Squeeze detection using band-width normalization
✅ Optional squeeze background highlighting
✅ Optional bar coloring by state
✅ Strategy-side selector: Long or Short
✅ Breakout signal state machine
✅ BUY / SELL / SHORT / CLOSE labels
✅ On-chart dashboard
✅ Optional last-value labels
✅ Fully customizable colors and style inputs
How to use
A practical reading flow is:
Watch for band contraction and squeeze conditions.
Treat that as a volatility compression phase.
Monitor for price expansion outside the bands.
Use the selected strategy mode to interpret the resulting signal sequence.
In practice:
tight bands + squeeze on = market compression
break above upper band = bullish expansion candidate
break below lower band = bearish expansion candidate
That said, Bollinger breakouts can fail in choppy environments, so many traders confirm them with momentum, volume, or higher timeframe structure rather than using them in isolation.
Notes
This indicator is designed as an enhanced Bollinger workflow tool, not as a complete trading system with full risk management. Bollinger Bands can support both breakout and mean-reversion approaches, so the best interpretation depends on market regime and confirmation methods.
Author: Gabremoku
Pine Script v6
Nota Keluaran
** minor fix improvement- deleted empty lines
Skrip sumber terbuka
Dalam semangat TradingView sebenar, pencipta skrip ini telah menjadikannya sumber terbuka, jadi pedagang boleh menilai dan mengesahkan kefungsiannya. Terima kasih kepada penulis! Walaupuan anda boleh menggunakan secara percuma, ingat bahawa penerbitan semula kod ini tertakluk kepada Peraturan Dalaman.

Penafian
Maklumat dan penerbitan adalah tidak bertujuan, dan tidak membentuk, nasihat atau cadangan kewangan, pelaburan, dagangan atau jenis lain yang diberikan atau disahkan oleh TradingView. Baca lebih dalam Terma Penggunaan.
Skrip sumber terbuka
Dalam semangat TradingView sebenar, pencipta skrip ini telah menjadikannya sumber terbuka, jadi pedagang boleh menilai dan mengesahkan kefungsiannya. Terima kasih kepada penulis! Walaupuan anda boleh menggunakan secara percuma, ingat bahawa penerbitan semula kod ini tertakluk kepada Peraturan Dalaman.
Penafian
Maklumat dan penerbitan adalah tidak bertujuan, dan tidak membentuk, nasihat atau cadangan kewangan, pelaburan, dagangan atau jenis lain yang diberikan atau disahkan oleh TradingView. Baca lebih dalam Terma Penggunaan.