OPEN-SOURCE SCRIPT
Telah dikemas kini Multiple MA Dashboard [PUCHON]
📊 Multiple MA Dashboard [PUCHON]
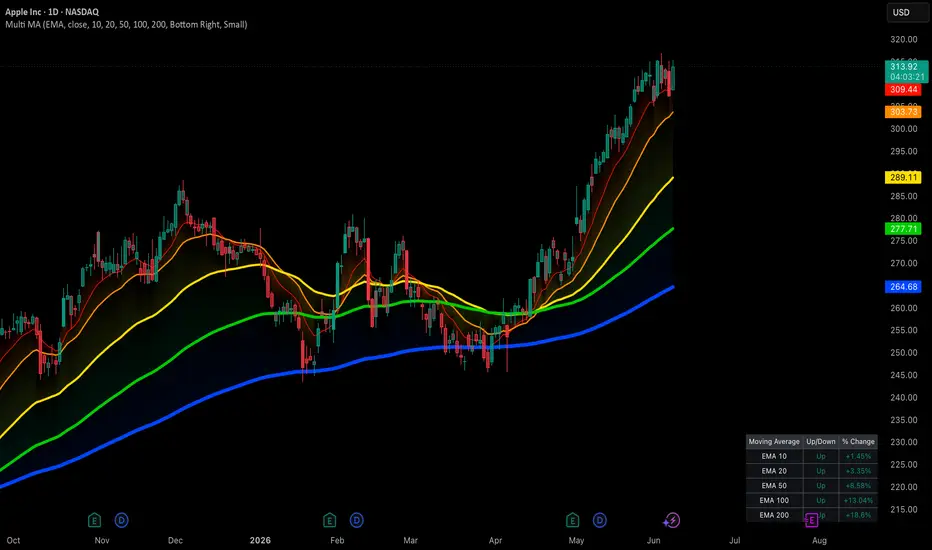
The Multiple MA Dashboard plots up to 5 moving averages of a chosen type (EMA, SMA, WMA, or RMA) directly on your chart and summarizes their relationship to price in a clean, real-time table. Instead of eyeballing where price sits relative to each average, this indicator gives you an instant Up/Down read and the exact percentage distance for every MA.
✨ Features:
- 📈 5 Configurable Moving Averages: Set independent lengths (defaults: 10, 20, 50, 100, 200) sharing one MA type and source.
- 🔁 Switchable MA Type: Choose between EMA, SMA, WMA, and RMA from a single dropdown — all 5 lines update together.
- 📋 Live Dashboard Table: Displays each MA's label, trend direction (Up/Down), and percentage distance from price, refreshed on the latest bar.
- 🎨 Dynamic Trend Coloring: Lines, fills, and table text automatically switch between your chosen "Up" and "Down" colors based on whether price is above or below each MA.
- 🌈 Price-to-MA Fill Zones: Shaded regions between price and each MA make the gap easy to see at a glance.
- ⚙️ Fully Customizable: Adjust MA lengths, source, dashboard position, text size, and theme colors to fit your setup.
🧮 Calculation Logic:
The core getMa function selects the moving average algorithm based on the user's choice, while each MA's color and table row are derived from a simple comparison between price and that MA.
Pine Script®
💡 Interpretation:
- 🟢 Up (price > MA): Price is trading above the average — shown in your "Up Trend" color with a positive % distance.
- 🔴 Down (price < MA): Price is trading below the average — shown in your "Down Trend" color with a negative % distance.
- 📏 % Change: The percentage gap between price and each MA, useful for gauging how stretched or compressed price is relative to that average.
⚠️ Disclaimer:
This tool is provided for educational and informational purposes only. It does not constitute financial advice and does not guarantee future performance. Always combine it with your own analysis and proper risk management.
The Multiple MA Dashboard plots up to 5 moving averages of a chosen type (EMA, SMA, WMA, or RMA) directly on your chart and summarizes their relationship to price in a clean, real-time table. Instead of eyeballing where price sits relative to each average, this indicator gives you an instant Up/Down read and the exact percentage distance for every MA.
✨ Features:
- 📈 5 Configurable Moving Averages: Set independent lengths (defaults: 10, 20, 50, 100, 200) sharing one MA type and source.
- 🔁 Switchable MA Type: Choose between EMA, SMA, WMA, and RMA from a single dropdown — all 5 lines update together.
- 📋 Live Dashboard Table: Displays each MA's label, trend direction (Up/Down), and percentage distance from price, refreshed on the latest bar.
- 🎨 Dynamic Trend Coloring: Lines, fills, and table text automatically switch between your chosen "Up" and "Down" colors based on whether price is above or below each MA.
- 🌈 Price-to-MA Fill Zones: Shaded regions between price and each MA make the gap easy to see at a glance.
- ⚙️ Fully Customizable: Adjust MA lengths, source, dashboard position, text size, and theme colors to fit your setup.
🧮 Calculation Logic:
The core getMa function selects the moving average algorithm based on the user's choice, while each MA's color and table row are derived from a simple comparison between price and that MA.
💡 Interpretation:
- 🟢 Up (price > MA): Price is trading above the average — shown in your "Up Trend" color with a positive % distance.
- 🔴 Down (price < MA): Price is trading below the average — shown in your "Down Trend" color with a negative % distance.
- 📏 % Change: The percentage gap between price and each MA, useful for gauging how stretched or compressed price is relative to that average.
⚠️ Disclaimer:
This tool is provided for educational and informational purposes only. It does not constitute financial advice and does not guarantee future performance. Always combine it with your own analysis and proper risk management.
Nota Keluaran
Updated: Able to adjust color on MANota Keluaran
Fixed: NameSkrip sumber terbuka
Dalam semangat TradingView sebenar, pencipta skrip ini telah menjadikannya sumber terbuka, jadi pedagang boleh menilai dan mengesahkan kefungsiannya. Terima kasih kepada penulis! Walaupuan anda boleh menggunakan secara percuma, ingat bahawa penerbitan semula kod ini tertakluk kepada Peraturan Dalaman.

Penafian
Maklumat dan penerbitan adalah tidak bertujuan, dan tidak membentuk, nasihat atau cadangan kewangan, pelaburan, dagangan atau jenis lain yang diberikan atau disahkan oleh TradingView. Baca lebih dalam Terma Penggunaan.
Skrip sumber terbuka
Dalam semangat TradingView sebenar, pencipta skrip ini telah menjadikannya sumber terbuka, jadi pedagang boleh menilai dan mengesahkan kefungsiannya. Terima kasih kepada penulis! Walaupuan anda boleh menggunakan secara percuma, ingat bahawa penerbitan semula kod ini tertakluk kepada Peraturan Dalaman.
Penafian
Maklumat dan penerbitan adalah tidak bertujuan, dan tidak membentuk, nasihat atau cadangan kewangan, pelaburan, dagangan atau jenis lain yang diberikan atau disahkan oleh TradingView. Baca lebih dalam Terma Penggunaan.