OPEN-SOURCE SCRIPT
ECG SLIVER
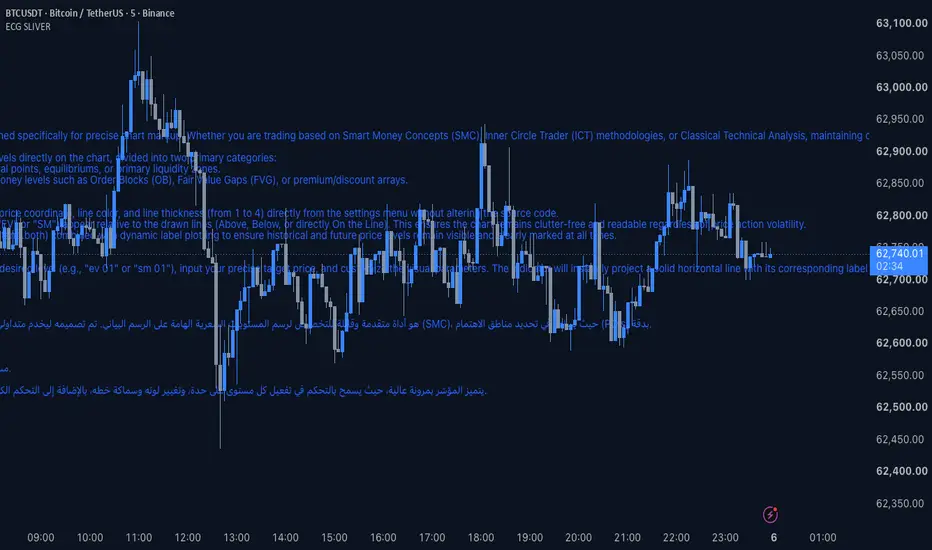
The "ECG SLIVER" is a robust, highly customizable price-level plotting tool designed specifically for precise chart markup. Whether you are trading based on Smart Money Concepts (SMC), Inner Circle Trader (ICT) methodologies, or Classical Technical Analysis, maintaining clean and accurately labeled charts is critical for defining Points of Interest (POIs).
This indicator allows traders to manually define and plot up to 60 distinct price levels directly on the chart, divided into two primary categories:
1. EV Levels (Blue by default): 30 distinct input fields to map out specific structural points, equilibriums, or primary liquidity zones.
2. SM Levels (Red by default): 30 additional fields, ideal for mapping out Smart Money levels such as Order Blocks (OB), Fair Value Gaps (FVG), or premium/discount arrays.
Key Features:
- High Customizability: Toggle visibility for each individual level. Adjust the exact price coordinate, line color, and line thickness (from 1 to 4) directly from the settings menu without altering the source code.
- Dynamic Label Positioning: Users can globally configure where the text labels ("EV" or "SM") appear relative to the drawn lines (Above, Below, or directly On the Line). This ensures the chart remains clutter-free and readable regardless of price action volatility.
- Persistent Projections: The script utilizes standard horizontal line extensions (extend.both) combined with dynamic label plotting to ensure historical and future price levels remain visible and clearly marked at all times.
How to Use:
Simply open the indicator's configuration menu, check the boolean box next to a desired level (e.g., "ev 01" or "sm 01"), input your precise target price, and customize the visual parameters. The indicator will instantly project a solid horizontal line with its corresponding label at your specified coordinate.
---
(Arabic Translation / ترجمة عربية)
مؤشر "ECG SLIVER" هو أداة متقدمة وقابلة للتخصيص لرسم المستويات السعرية الهامة على الرسم البياني. تم تصميمه ليخدم متداولي المدارس الفنية المختلفة مثل التحليل الكلاسيكي ومفاهيم الأموال الذكية (SMC)، حيث يساعد في تحديد مناطق الاهتمام (POIs) بدقة.
يوفر المؤشر القدرة على إدخال ما يصل إلى 60 مستوى سعري مقسمة إلى مجموعتين:
1. مستويات EV: 30 مستوى (باللون الأزرق افتراضياً) لتحديد النقاط الهيكلية أو مناطق السيولة.
2. مستويات SM: 30 مستوى (باللون الأحمر افتراضياً) لتحديد مناطق العرض والطلب أو الأوردر بلوك.
يتميز المؤشر بمرونة عالية، حيث يسمح بالتحكم في تفعيل كل مستوى على حدة، وتغيير لونه وسماكة خطه، بالإضافة إلى التحكم الكامل في موضع الكلمة الدلالية (فوق، تحت، أو على الخط مباشرة) لضمان بقاء الشارت نظيفاً ومنظماً.
This indicator allows traders to manually define and plot up to 60 distinct price levels directly on the chart, divided into two primary categories:
1. EV Levels (Blue by default): 30 distinct input fields to map out specific structural points, equilibriums, or primary liquidity zones.
2. SM Levels (Red by default): 30 additional fields, ideal for mapping out Smart Money levels such as Order Blocks (OB), Fair Value Gaps (FVG), or premium/discount arrays.
Key Features:
- High Customizability: Toggle visibility for each individual level. Adjust the exact price coordinate, line color, and line thickness (from 1 to 4) directly from the settings menu without altering the source code.
- Dynamic Label Positioning: Users can globally configure where the text labels ("EV" or "SM") appear relative to the drawn lines (Above, Below, or directly On the Line). This ensures the chart remains clutter-free and readable regardless of price action volatility.
- Persistent Projections: The script utilizes standard horizontal line extensions (extend.both) combined with dynamic label plotting to ensure historical and future price levels remain visible and clearly marked at all times.
How to Use:
Simply open the indicator's configuration menu, check the boolean box next to a desired level (e.g., "ev 01" or "sm 01"), input your precise target price, and customize the visual parameters. The indicator will instantly project a solid horizontal line with its corresponding label at your specified coordinate.
---
(Arabic Translation / ترجمة عربية)
مؤشر "ECG SLIVER" هو أداة متقدمة وقابلة للتخصيص لرسم المستويات السعرية الهامة على الرسم البياني. تم تصميمه ليخدم متداولي المدارس الفنية المختلفة مثل التحليل الكلاسيكي ومفاهيم الأموال الذكية (SMC)، حيث يساعد في تحديد مناطق الاهتمام (POIs) بدقة.
يوفر المؤشر القدرة على إدخال ما يصل إلى 60 مستوى سعري مقسمة إلى مجموعتين:
1. مستويات EV: 30 مستوى (باللون الأزرق افتراضياً) لتحديد النقاط الهيكلية أو مناطق السيولة.
2. مستويات SM: 30 مستوى (باللون الأحمر افتراضياً) لتحديد مناطق العرض والطلب أو الأوردر بلوك.
يتميز المؤشر بمرونة عالية، حيث يسمح بالتحكم في تفعيل كل مستوى على حدة، وتغيير لونه وسماكة خطه، بالإضافة إلى التحكم الكامل في موضع الكلمة الدلالية (فوق، تحت، أو على الخط مباشرة) لضمان بقاء الشارت نظيفاً ومنظماً.
Skrip sumber terbuka
Dalam semangat TradingView sebenar, pencipta skrip ini telah menjadikannya sumber terbuka, jadi pedagang boleh menilai dan mengesahkan kefungsiannya. Terima kasih kepada penulis! Walaupuan anda boleh menggunakan secara percuma, ingat bahawa penerbitan semula kod ini tertakluk kepada Peraturan Dalaman.

Penafian
Maklumat dan penerbitan adalah tidak bertujuan, dan tidak membentuk, nasihat atau cadangan kewangan, pelaburan, dagangan atau jenis lain yang diberikan atau disahkan oleh TradingView. Baca lebih dalam Terma Penggunaan.
Skrip sumber terbuka
Dalam semangat TradingView sebenar, pencipta skrip ini telah menjadikannya sumber terbuka, jadi pedagang boleh menilai dan mengesahkan kefungsiannya. Terima kasih kepada penulis! Walaupuan anda boleh menggunakan secara percuma, ingat bahawa penerbitan semula kod ini tertakluk kepada Peraturan Dalaman.
Penafian
Maklumat dan penerbitan adalah tidak bertujuan, dan tidak membentuk, nasihat atau cadangan kewangan, pelaburan, dagangan atau jenis lain yang diberikan atau disahkan oleh TradingView. Baca lebih dalam Terma Penggunaan.