OPEN-SOURCE SCRIPT
OB + 2G2R + EMA/BB/ST/VWAP + Doji + Day Levels
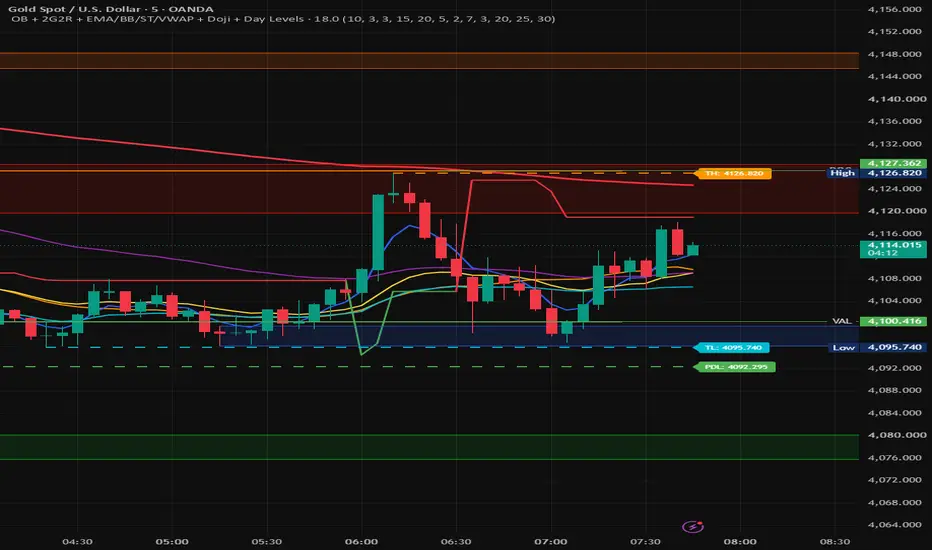
It is a multi-signal chart indicator. It does not place trades automatically; it plots trend tools, levels, and buy/sell markers.
It shows:
BB Mid — the 20-period SMA, used as the crossover reference.
EMA 5, EMA 20, EMA 50, EMA 200 — trend direction filters.
SuperTrend — green when bullish and red when bearish.
Today’s High and Today’s Low — running intraday high/low levels, updated as new candles form.
EMA BUY — EMA 5 crosses above BB Mid, the candle is bullish, and price is above EMA 20/50/200.
EMA SELL — EMA 5 crosses below BB Mid, the candle is bearish, and price is below EMA 20/50/200.
ST BUY / ST SELL — SuperTrend direction changes and the current candle breaks the previous candle’s high or low.
2R2G BUY — two bearish candles followed by two bullish candles.
2G2R SELL — two bullish candles followed by two bearish candles.
Doji Buy / Sell setups — a bullish-to-bearish or bearish-to-bullish two-candle sequence followed by a small-body doji.
The signals are independent. For example, a 2R2G marker does not require an EMA crossover or SuperTrend confirmation. The strongest practical use is to treat EMA trend, SuperTrend direction, and the candle pattern as confirmation together rather than entering on every marker.
It shows:
BB Mid — the 20-period SMA, used as the crossover reference.
EMA 5, EMA 20, EMA 50, EMA 200 — trend direction filters.
SuperTrend — green when bullish and red when bearish.
Today’s High and Today’s Low — running intraday high/low levels, updated as new candles form.
EMA BUY — EMA 5 crosses above BB Mid, the candle is bullish, and price is above EMA 20/50/200.
EMA SELL — EMA 5 crosses below BB Mid, the candle is bearish, and price is below EMA 20/50/200.
ST BUY / ST SELL — SuperTrend direction changes and the current candle breaks the previous candle’s high or low.
2R2G BUY — two bearish candles followed by two bullish candles.
2G2R SELL — two bullish candles followed by two bearish candles.
Doji Buy / Sell setups — a bullish-to-bearish or bearish-to-bullish two-candle sequence followed by a small-body doji.
The signals are independent. For example, a 2R2G marker does not require an EMA crossover or SuperTrend confirmation. The strongest practical use is to treat EMA trend, SuperTrend direction, and the candle pattern as confirmation together rather than entering on every marker.
Skrip sumber terbuka
Dalam semangat TradingView sebenar, pencipta skrip ini telah menjadikannya sumber terbuka, jadi pedagang boleh menilai dan mengesahkan kefungsiannya. Terima kasih kepada penulis! Walaupuan anda boleh menggunakan secara percuma, ingat bahawa penerbitan semula kod ini tertakluk kepada Peraturan Dalaman.

Penafian
Maklumat dan penerbitan adalah tidak bertujuan, dan tidak membentuk, nasihat atau cadangan kewangan, pelaburan, dagangan atau jenis lain yang diberikan atau disahkan oleh TradingView. Baca lebih dalam Terma Penggunaan.
Skrip sumber terbuka
Dalam semangat TradingView sebenar, pencipta skrip ini telah menjadikannya sumber terbuka, jadi pedagang boleh menilai dan mengesahkan kefungsiannya. Terima kasih kepada penulis! Walaupuan anda boleh menggunakan secara percuma, ingat bahawa penerbitan semula kod ini tertakluk kepada Peraturan Dalaman.
Penafian
Maklumat dan penerbitan adalah tidak bertujuan, dan tidak membentuk, nasihat atau cadangan kewangan, pelaburan, dagangan atau jenis lain yang diberikan atau disahkan oleh TradingView. Baca lebih dalam Terma Penggunaan.