OPEN-SOURCE SCRIPT
AMT Multi-Ticker Imbalance Dashboard [AMT] + Strength/Age Score
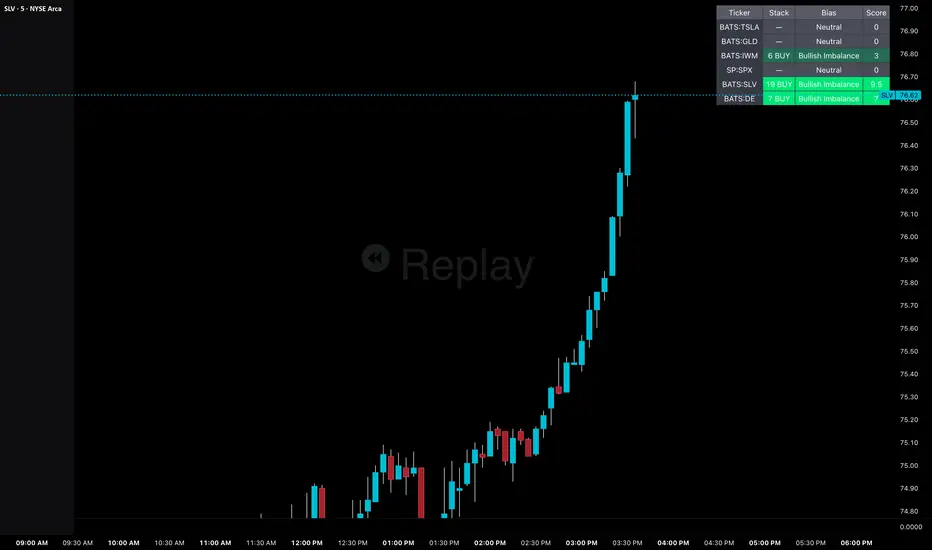
AMT Multi-Ticker Imbalance Dashboard [AMT] + Strength/Age Score
The AMT Multi-Ticker Imbalance Dashboard is a multi-asset volume imbalance scanner designed to detect, rank, and compare stacked buying or selling pressure across up to six symbols — all from a single chart.
This tool does not rely on simple candle direction or trend signals. Instead, it builds a structured micro-profile of price and volume distribution over a rolling lookback window, then identifies stacked volume dominance inside price bins. The result is a real-time dashboard that highlights where aggressive participation is building — and how strong and fresh that imbalance is.
What This Script Does
This script:
• Scans up to 6 user-defined tickers simultaneously
• Builds a rolling price-volume profile over a configurable lookback
• Detects stacked buy or sell imbalances inside price bins
• Measures imbalance strength (stack size)
• Tracks imbalance age (how recent it triggered)
• Calculates a weighted strength score
• Displays everything in a color-graded dashboard
It functions as a cross-market orderflow pressure monitor, helping traders identify where initiative activity is expanding across correlated or leading assets.
The Core Concept: Stacked Volume Imbalances
Instead of evaluating the whole bar as bullish or bearish, the script:
Takes the last Profile Lookback bars.
Finds the highest high and lowest low.
Divides that range into Profile Resolution bins (price slices).
Inside each bin, it calculates:
Total buy volume (close > open)
Total sell volume (open > close)
It then measures dominance:
Buy imbalance = Buy volume ≥ threshold % of total volume
Sell imbalance = Sell volume ≥ threshold % of total volume
If multiple consecutive bins meet that dominance threshold, they form a stack.
Stack size represents how many adjacent price zones show aggressive one-sided participation.
Why Stacked Imbalances Matter
Single imbalances can be noise.
Stacked imbalances suggest:
• Aggressive initiative activity
• Strong directional conviction
• Potential continuation pressure
• Possible structural repricing
The script only signals when the stack size meets or exceeds the Stack Size Trigger, filtering weak participation.
Dashboard Columns Explained
1️⃣ Ticker
The symbol being scanned.
2️⃣ Stack
Displays:
“X BUY” → number of consecutive buy imbalance bins
“X SELL” → number of consecutive sell imbalance bins
“—” → no qualifying imbalance
3️⃣ Bias
Directional interpretation:
Bullish Imbalance
Bearish Imbalance
Neutral
4️⃣ Score (Strength + Recency Weighted)
The score combines:
Stack Size × Age Weight
Age weighting logic:
New signal (age = 0 bars): 1.5x multiplier
1–3 bars old: 1.0x multiplier
Older than 3 bars: 0.5x multiplier
This means:
• Fresh imbalances rank higher
• Older signals decay in importance
• Strong and new stacks visually dominate
Color Logic
Color intensity reflects both direction and weighted strength:
Bullish
Bright Green → Strong + Fresh
Medium Green → Moderate
Dim Green → Weak or Aging
Bearish
Bright Red → Strong + Fresh
Medium Red → Moderate
Dim Red → Weak or Aging
Neutral = Gray
This allows instant visual ranking across assets.
Inputs Explained
Profile Lookback
Number of bars used to build the rolling profile.
Smaller values:
• Faster responsiveness
• More reactive
Larger values:
• Smoother structure
• More institutional footprint detection
Profile Resolution
Number of bins dividing the price range.
Higher resolution:
• More granular imbalance detection
• More sensitive stacking
Lower resolution:
• Broader structural imbalance zones
Bin Imbalance Threshold
Minimum % dominance required to qualify.
Default: 0.75 (75%)
Higher:
• Stronger conviction required
• Fewer but more aggressive signals
Lower:
• More frequent but softer signals
Stack Size Trigger
Minimum consecutive imbalance bins required.
This filters weak activity and prevents single-bin noise.
Dashboard Position
Choose where the table appears.
How This Script Is Original
This is not:
• A delta oscillator
• A cumulative volume line
• A simple up/down volume ratio
• A standard volume profile
It uniquely combines:
Rolling dynamic profile construction
Per-bin dominance calculation
Consecutive imbalance stacking
Multi-ticker cross-asset scanning
Age-weighted strength scoring
Visual ranking dashboard
Most imbalance tools operate on a single chart and focus on visual zones.
This script transforms imbalance logic into a comparative, cross-market decision tool.
How Traders Can Use It:
Market Leadership Detection
Identify which asset is currently driving momentum.
Example:
If IWM shows a fresh 5 BUY stack while SPX shows neutral → small caps may be leading risk appetite.
Confirmation Tool
Use imbalance confirmation before entering:
• Breakouts
• Acceptance above value
• Fair value gap continuation
• Sequence continuation setups
Rotation Monitoring
Watch for:
• Bullish stacks turning neutral
• Bearish stacks emerging in correlated assets
• Leadership shifting across sectors
Timing Advantage
Fresh stacks (bright colors + high score) highlight where initiative flow is most recent — often before broader price expansion.
Important Notes
• Signals are calculated on the chart’s current timeframe.
• Higher timeframes detect structural imbalance.
• Lower timeframes detect short-term aggression.
• This is a participation pressure scanner — not a standalone entry trigger.
• Always confirm with structure, liquidity, and context.
Summary
The AMT Multi-Ticker Imbalance Dashboard transforms raw volume into structured imbalance intelligence.
It tells you:
• Who is dominant (buyers or sellers)
• How strong that dominance is
• How fresh it is
• Which asset is leading
I
nstead of watching one chart, you monitor relative aggressive participation across six markets — in real time — with objective scoring and visual ranking.
This allows traders to align with the strongest active pressure, avoid fading initiative flow, and improve timing precision through imbalance awareness.
The AMT Multi-Ticker Imbalance Dashboard is a multi-asset volume imbalance scanner designed to detect, rank, and compare stacked buying or selling pressure across up to six symbols — all from a single chart.
This tool does not rely on simple candle direction or trend signals. Instead, it builds a structured micro-profile of price and volume distribution over a rolling lookback window, then identifies stacked volume dominance inside price bins. The result is a real-time dashboard that highlights where aggressive participation is building — and how strong and fresh that imbalance is.
What This Script Does
This script:
• Scans up to 6 user-defined tickers simultaneously
• Builds a rolling price-volume profile over a configurable lookback
• Detects stacked buy or sell imbalances inside price bins
• Measures imbalance strength (stack size)
• Tracks imbalance age (how recent it triggered)
• Calculates a weighted strength score
• Displays everything in a color-graded dashboard
It functions as a cross-market orderflow pressure monitor, helping traders identify where initiative activity is expanding across correlated or leading assets.
The Core Concept: Stacked Volume Imbalances
Instead of evaluating the whole bar as bullish or bearish, the script:
Takes the last Profile Lookback bars.
Finds the highest high and lowest low.
Divides that range into Profile Resolution bins (price slices).
Inside each bin, it calculates:
Total buy volume (close > open)
Total sell volume (open > close)
It then measures dominance:
Buy imbalance = Buy volume ≥ threshold % of total volume
Sell imbalance = Sell volume ≥ threshold % of total volume
If multiple consecutive bins meet that dominance threshold, they form a stack.
Stack size represents how many adjacent price zones show aggressive one-sided participation.
Why Stacked Imbalances Matter
Single imbalances can be noise.
Stacked imbalances suggest:
• Aggressive initiative activity
• Strong directional conviction
• Potential continuation pressure
• Possible structural repricing
The script only signals when the stack size meets or exceeds the Stack Size Trigger, filtering weak participation.
Dashboard Columns Explained
1️⃣ Ticker
The symbol being scanned.
2️⃣ Stack
Displays:
“X BUY” → number of consecutive buy imbalance bins
“X SELL” → number of consecutive sell imbalance bins
“—” → no qualifying imbalance
3️⃣ Bias
Directional interpretation:
Bullish Imbalance
Bearish Imbalance
Neutral
4️⃣ Score (Strength + Recency Weighted)
The score combines:
Stack Size × Age Weight
Age weighting logic:
New signal (age = 0 bars): 1.5x multiplier
1–3 bars old: 1.0x multiplier
Older than 3 bars: 0.5x multiplier
This means:
• Fresh imbalances rank higher
• Older signals decay in importance
• Strong and new stacks visually dominate
Color Logic
Color intensity reflects both direction and weighted strength:
Bullish
Bright Green → Strong + Fresh
Medium Green → Moderate
Dim Green → Weak or Aging
Bearish
Bright Red → Strong + Fresh
Medium Red → Moderate
Dim Red → Weak or Aging
Neutral = Gray
This allows instant visual ranking across assets.
Inputs Explained
Profile Lookback
Number of bars used to build the rolling profile.
Smaller values:
• Faster responsiveness
• More reactive
Larger values:
• Smoother structure
• More institutional footprint detection
Profile Resolution
Number of bins dividing the price range.
Higher resolution:
• More granular imbalance detection
• More sensitive stacking
Lower resolution:
• Broader structural imbalance zones
Bin Imbalance Threshold
Minimum % dominance required to qualify.
Default: 0.75 (75%)
Higher:
• Stronger conviction required
• Fewer but more aggressive signals
Lower:
• More frequent but softer signals
Stack Size Trigger
Minimum consecutive imbalance bins required.
This filters weak activity and prevents single-bin noise.
Dashboard Position
Choose where the table appears.
How This Script Is Original
This is not:
• A delta oscillator
• A cumulative volume line
• A simple up/down volume ratio
• A standard volume profile
It uniquely combines:
Rolling dynamic profile construction
Per-bin dominance calculation
Consecutive imbalance stacking
Multi-ticker cross-asset scanning
Age-weighted strength scoring
Visual ranking dashboard
Most imbalance tools operate on a single chart and focus on visual zones.
This script transforms imbalance logic into a comparative, cross-market decision tool.
How Traders Can Use It:
Market Leadership Detection
Identify which asset is currently driving momentum.
Example:
If IWM shows a fresh 5 BUY stack while SPX shows neutral → small caps may be leading risk appetite.
Confirmation Tool
Use imbalance confirmation before entering:
• Breakouts
• Acceptance above value
• Fair value gap continuation
• Sequence continuation setups
Rotation Monitoring
Watch for:
• Bullish stacks turning neutral
• Bearish stacks emerging in correlated assets
• Leadership shifting across sectors
Timing Advantage
Fresh stacks (bright colors + high score) highlight where initiative flow is most recent — often before broader price expansion.
Important Notes
• Signals are calculated on the chart’s current timeframe.
• Higher timeframes detect structural imbalance.
• Lower timeframes detect short-term aggression.
• This is a participation pressure scanner — not a standalone entry trigger.
• Always confirm with structure, liquidity, and context.
Summary
The AMT Multi-Ticker Imbalance Dashboard transforms raw volume into structured imbalance intelligence.
It tells you:
• Who is dominant (buyers or sellers)
• How strong that dominance is
• How fresh it is
• Which asset is leading
I
nstead of watching one chart, you monitor relative aggressive participation across six markets — in real time — with objective scoring and visual ranking.
This allows traders to align with the strongest active pressure, avoid fading initiative flow, and improve timing precision through imbalance awareness.
Skrip sumber terbuka
Dalam semangat TradingView sebenar, pencipta skrip ini telah menjadikannya sumber terbuka, jadi pedagang boleh menilai dan mengesahkan kefungsiannya. Terima kasih kepada penulis! Walaupuan anda boleh menggunakan secara percuma, ingat bahawa penerbitan semula kod ini tertakluk kepada Peraturan Dalaman.

Penafian
Maklumat dan penerbitan adalah tidak bertujuan, dan tidak membentuk, nasihat atau cadangan kewangan, pelaburan, dagangan atau jenis lain yang diberikan atau disahkan oleh TradingView. Baca lebih dalam Terma Penggunaan.
Skrip sumber terbuka
Dalam semangat TradingView sebenar, pencipta skrip ini telah menjadikannya sumber terbuka, jadi pedagang boleh menilai dan mengesahkan kefungsiannya. Terima kasih kepada penulis! Walaupuan anda boleh menggunakan secara percuma, ingat bahawa penerbitan semula kod ini tertakluk kepada Peraturan Dalaman.
Penafian
Maklumat dan penerbitan adalah tidak bertujuan, dan tidak membentuk, nasihat atau cadangan kewangan, pelaburan, dagangan atau jenis lain yang diberikan atau disahkan oleh TradingView. Baca lebih dalam Terma Penggunaan.