OPEN-SOURCE SCRIPT
CVD Oscillator (BEST)
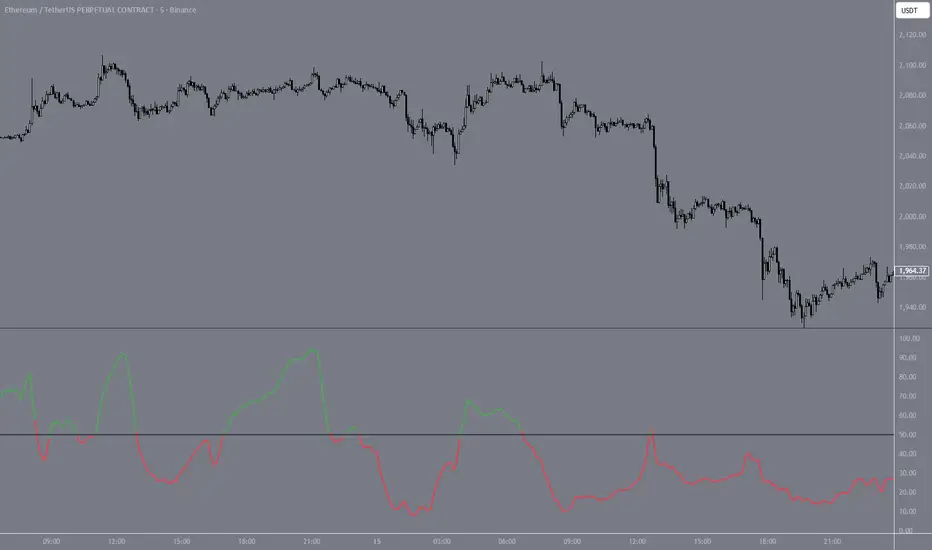
Estimates Cumulative Volume Delta from OHLCV candle data and normalizes it to a 0-100 scale. Approximates order flow without tick-level data by measuring where each candle closes within its range, weighted by volume — closes near the high register as buying pressure, closes near the low as selling pressure.
The raw CVD is normalized over a rolling lookback window and smoothed with an EMA. Readings above 50 indicate buyers dominating relative to recent history, below 50 indicates sellers. Useful for spotting divergences between price and volume flow — e.g. price making new highs while the oscillator declines suggests weakening buyer conviction.
The raw CVD is normalized over a rolling lookback window and smoothed with an EMA. Readings above 50 indicate buyers dominating relative to recent history, below 50 indicates sellers. Useful for spotting divergences between price and volume flow — e.g. price making new highs while the oscillator declines suggests weakening buyer conviction.
Skrip sumber terbuka
Dalam semangat TradingView sebenar, pencipta skrip ini telah menjadikannya sumber terbuka, jadi pedagang boleh menilai dan mengesahkan kefungsiannya. Terima kasih kepada penulis! Walaupuan anda boleh menggunakan secara percuma, ingat bahawa penerbitan semula kod ini tertakluk kepada Peraturan Dalaman.

Penafian
Maklumat dan penerbitan adalah tidak bertujuan, dan tidak membentuk, nasihat atau cadangan kewangan, pelaburan, dagangan atau jenis lain yang diberikan atau disahkan oleh TradingView. Baca lebih dalam Terma Penggunaan.
Skrip sumber terbuka
Dalam semangat TradingView sebenar, pencipta skrip ini telah menjadikannya sumber terbuka, jadi pedagang boleh menilai dan mengesahkan kefungsiannya. Terima kasih kepada penulis! Walaupuan anda boleh menggunakan secara percuma, ingat bahawa penerbitan semula kod ini tertakluk kepada Peraturan Dalaman.
Penafian
Maklumat dan penerbitan adalah tidak bertujuan, dan tidak membentuk, nasihat atau cadangan kewangan, pelaburan, dagangan atau jenis lain yang diberikan atau disahkan oleh TradingView. Baca lebih dalam Terma Penggunaan.