OPEN-SOURCE SCRIPT
Dr. David Paul Earnings Swing System
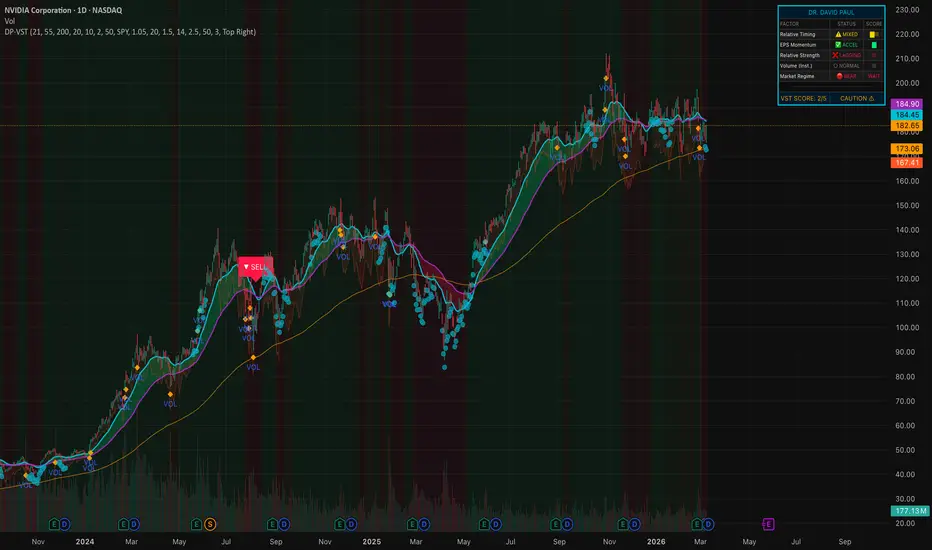
A visually intuitive swing trading indicator built on Dr. David Paul's VectorVest
methodology — scoring earnings momentum, relative strength, trend timing & market
regime in one unified dashboard.
This indicator translates Dr. David Paul's world-renowned VectorVest stock selection
and market timing methodology into a fully visual, real-time scoring system directly
on your TradingView chart.
Dr. Paul's philosophy is simple but powerful: buy stocks with ACCELERATING EARNINGS,
trading ABOVE VALUE, in CONFIRMED BULL MARKETS — and exit when any of those conditions
breaks down.
VectorVest ranks every stock with a composite VST score built from three proprietary
metrics. This indicator approximates that framework with five measurable factors:
1. RELATIVE TIMING (Trend Ribbon)
— Dual EMA ribbon (Fast 21 / Slow 55) signals trend direction
— Price above 200 EMA confirms long-term bull structure
— Green ribbon = uptrend confirmed; Red ribbon = stand aside
2. EPS MOMENTUM PROXY (Earnings Acceleration)
— Rate-of-Change acceleration simulates EPS growth trajectory
— Dr. Paul's core principle: "You want earnings growing AND accelerating"
— Cyan dots below price indicate active earnings acceleration
3. RELATIVE STRENGTH vs. Market (RS Ratio)
— Stock performance benchmarked against SPY (configurable)
— Only trade stocks OUTPERFORMING the market
— Mirrors VectorVest's RS (Relative Safety/Strength) component
4. VOLUME SURGE (Institutional Interest)
— Detects above-average volume (default: 1.5× 20-period average)
— Orange diamonds mark institutional accumulation signals
— Dr. Paul: "Follow the smart money — big volume = big players"
5. MARKET REGIME (Color Guard System)
— Background shading: GREEN = Bull, RED = Bear, AMBER = Neutral
— Based on Dr. Paul's "Color Guard" concept from VectorVest
— ONLY take buy signals in GREEN (Bull) market regime
BUY Signal (Green Label)
Fires when ALL of the following align:
• Composite Score ≥ user-defined minimum (default: 3/5)
• Fast EMA crosses above Slow EMA (trend confirmation)
• Market in Bull Regime
• EPS acceleration active
• Stock outperforming benchmark
• RSI below 75 (not extended/overbought)
SELL Signal (Red Label)
Fires when:
• Fast EMA crosses below Slow EMA
• Market enters Bear Regime
• Composite Score collapses to ≤ 1
A real-time table (top-right by default) shows:
• Each factor's current status with icons
• Visual block meter for each score
• Final VST composite score out of 5
• Verdict: STRONG BUY / WATCH / CAUTION / AVOID
• Trend Ribbon — EMA cloud (green/red fill)
• Bar Colors — Score-graded from bright green (5) to red (0)
• Stop Zone — ATR-based trailing stop band (orange)
• Regime Background — Faint green/red/amber shading
• EPS Dots — Cyan circles during acceleration phases
• Volume Diamonds — Orange on institutional surge bars
• Buy/Sell Labels — Clear directional arrows with text
All key parameters are adjustable:
• EMA lengths (Fast, Slow, Trend Filter)
• EPS ROC lookback & acceleration threshold
• Benchmark symbol (default: SPY)
• Volume surge multiplier
• ATR stop multiplier
• Minimum score threshold for signals
• Dashboard position
• Toggle each visual component on/off
1. BUY Signal fired
2. SELL / Exit Signal fired
3. High-Score Setup (4+ score in bull market)
4. Volume + EPS Surge combo detecte
This indicator uses PRICE-BASED PROXIES to simulate VectorVest's proprietary
fundamental data (EPS, VST, GRT). For full fundamental scoring, access to
VectorVest platform data is required.
•The EPS Momentum Proxy uses Rate-of-Change acceleration as a substitute for
actual earnings-per-share data — it reflects price momentum consistent with
earnings-driven moves.
•PAST PERFORMANCE IS NOT INDICATIVE OF FUTURE RESULTS. This tool is for
educational and informational purposes only. Always use proper risk management.
Best used on Daily and Weekly timeframes for swing trading, consistent with
Dr. Paul's documented methodology.
This indicator is inspired by the publicly taught trading methodology of
Dr. David Paul, as presented in his VectorVest seminars and educational
content. All core concepts — earnings acceleration, relative value,
relative safety, market timing, and the Color Guard system — are
attributable to Dr. Paul's work.
special thanks to Beck_Mullen for helping me learn , develop , and understand how to build my own scripts and refine them for my own personal trading!
Skrip sumber terbuka
Dalam semangat TradingView sebenar, pencipta skrip ini telah menjadikannya sumber terbuka, jadi pedagang boleh menilai dan mengesahkan kefungsiannya. Terima kasih kepada penulis! Walaupuan anda boleh menggunakan secara percuma, ingat bahawa penerbitan semula kod ini tertakluk kepada Peraturan Dalaman.

Penafian
Maklumat dan penerbitan adalah tidak bertujuan, dan tidak membentuk, nasihat atau cadangan kewangan, pelaburan, dagangan atau jenis lain yang diberikan atau disahkan oleh TradingView. Baca lebih dalam Terma Penggunaan.
Skrip sumber terbuka
Dalam semangat TradingView sebenar, pencipta skrip ini telah menjadikannya sumber terbuka, jadi pedagang boleh menilai dan mengesahkan kefungsiannya. Terima kasih kepada penulis! Walaupuan anda boleh menggunakan secara percuma, ingat bahawa penerbitan semula kod ini tertakluk kepada Peraturan Dalaman.
Penafian
Maklumat dan penerbitan adalah tidak bertujuan, dan tidak membentuk, nasihat atau cadangan kewangan, pelaburan, dagangan atau jenis lain yang diberikan atau disahkan oleh TradingView. Baca lebih dalam Terma Penggunaan.