Opening Range Levels
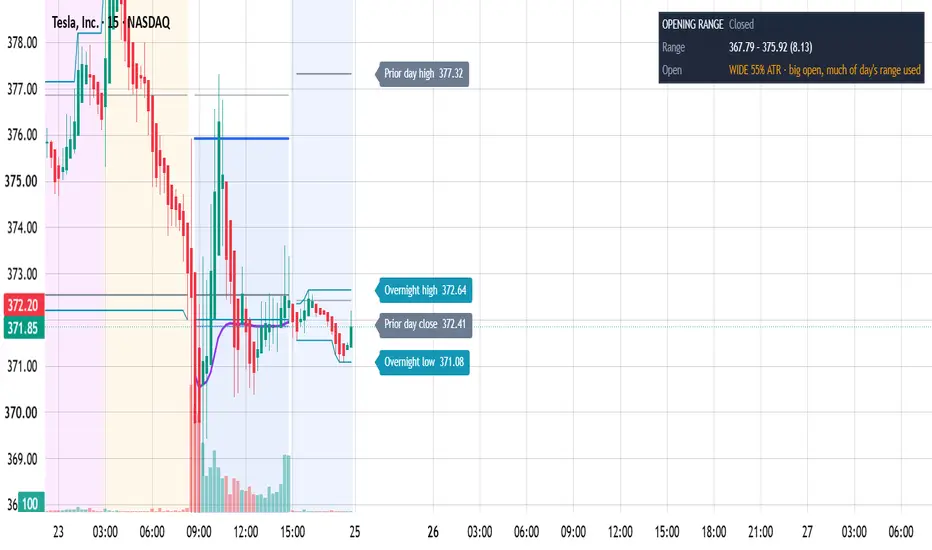
Opening Range Levels — Lite
What it does
Draws the session opening range and the structural levels intraday traders reference around it, each named at the right edge with its exact price:
• Opening range high, low and middle (length in minutes, default 15)
• 1× range moves above and below the range (range height added to the high / subtracted from the low)
• Session VWAP (regular session only, typical price × volume)
• Prior day high, low and close (last completed regular session)
• Overnight high and low (bars outside the regular session; needs extended hours enabled)
Reading the open
The info box shows the opening range as a percentage of the prior day's 14-period ATR:
• NARROW (≤ 20%) – a quiet open; the day still has most of its typical range available
• NORMAL
• WIDE (≥ 40%) – a large open; much of a typical day's range is already used
Both thresholds are inputs. The classification describes the open; it is not a signal.
How to use
• Use a chart timeframe that divides the range length evenly: 1, 3, 5 or 15 minutes for a 15-minute range; 1 or 5 minutes for a 5-minute range. The box says so if the timeframe doesn't fit, instead of drawing a wrong range.
• Default session is 09:30–16:00 New York. Change the session and timezone for other markets.
• Outside regular hours (extended-hours charts), "prior day" means the session that just closed and the overnight levels update live, so the chart is ready for the next open.
• "Show levels for: Today only" keeps the chart clean; switch to "All sessions" to review past days.
Display
• Labels stack so they never overlap; raise "Label spacing" on tall charts.
• Line colors are set per line in the Style tab. Label colors are in Inputs.
• Line values are kept off the price scale and status line to reduce clutter; re-enable them per line in the Style tab.
Limits
• No signals, alerts or targets.
• Values do not repaint: the ATR uses the prior completed day only.
• Overnight levels need extended hours enabled; VWAP needs volume data.
• On Heikin Ashi charts the levels use Heikin Ashi values; use standard candles.
What it does
Draws the session opening range and the structural levels intraday traders reference around it, each named at the right edge with its exact price:
• Opening range high, low and middle (length in minutes, default 15)
• 1× range moves above and below the range (range height added to the high / subtracted from the low)
• Session VWAP (regular session only, typical price × volume)
• Prior day high, low and close (last completed regular session)
• Overnight high and low (bars outside the regular session; needs extended hours enabled)
Reading the open
The info box shows the opening range as a percentage of the prior day's 14-period ATR:
• NARROW (≤ 20%) – a quiet open; the day still has most of its typical range available
• NORMAL
• WIDE (≥ 40%) – a large open; much of a typical day's range is already used
Both thresholds are inputs. The classification describes the open; it is not a signal.
How to use
• Use a chart timeframe that divides the range length evenly: 1, 3, 5 or 15 minutes for a 15-minute range; 1 or 5 minutes for a 5-minute range. The box says so if the timeframe doesn't fit, instead of drawing a wrong range.
• Default session is 09:30–16:00 New York. Change the session and timezone for other markets.
• Outside regular hours (extended-hours charts), "prior day" means the session that just closed and the overnight levels update live, so the chart is ready for the next open.
• "Show levels for: Today only" keeps the chart clean; switch to "All sessions" to review past days.
Display
• Labels stack so they never overlap; raise "Label spacing" on tall charts.
• Line colors are set per line in the Style tab. Label colors are in Inputs.
• Line values are kept off the price scale and status line to reduce clutter; re-enable them per line in the Style tab.
Limits
• No signals, alerts or targets.
• Values do not repaint: the ATR uses the prior completed day only.
• Overnight levels need extended hours enabled; VWAP needs volume data.
• On Heikin Ashi charts the levels use Heikin Ashi values; use standard candles.

Penafian
Maklumat dan penerbitan adalah tidak bertujuan, dan tidak membentuk, nasihat atau cadangan kewangan, pelaburan, dagangan atau jenis lain yang diberikan atau disahkan oleh TradingView. Baca lebih dalam Terma Penggunaan.
Penafian
Maklumat dan penerbitan adalah tidak bertujuan, dan tidak membentuk, nasihat atau cadangan kewangan, pelaburan, dagangan atau jenis lain yang diberikan atau disahkan oleh TradingView. Baca lebih dalam Terma Penggunaan.