OPEN-SOURCE SCRIPT
CandelaCharts - Quadratic Killzones
📝 Overview
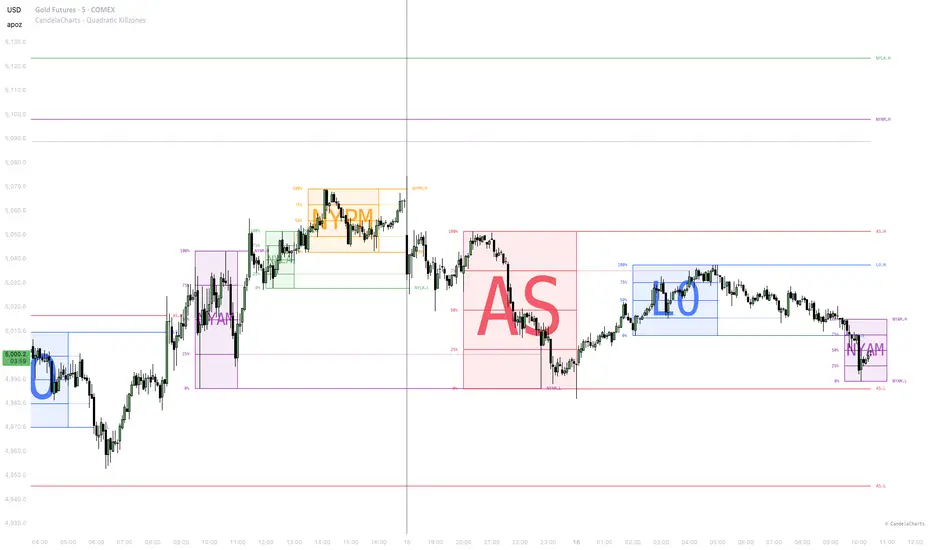
The Quadratic Killzones indicator is a specialized tool for visualizing key trading sessions and their price ranges divided into quadrants.
These session ranges are significant because they help traders identify potential support and resistance zones based on session highs and lows. The indicator tracks multiple sessions (Asia, London Open, NY AM, NY Lunch, NY PM) and displays their price ranges with quadrant levels (0%, 25%, 50%, 75%, 100%).
Session highs and lows serve as key reference points for intraday traders. The quadrant divisions help identify premium (above 50%) and discount (below 50%) zones within each session's range.
📦 Features
Key features of the indicator include:
⚙️ Settings
History
Session Settings (First through Fifth + Custom)
Styles
Dividers
🌟 Benefits
Why use Quadratic Killzones over standard session indicators?
⚡️ Showcase
Session Boxes

Session Boxes with Quadrants

Session Boxes with Labels

Session Deviders

Multiple Sessions

🚨 Alerts
This indicator does not include built-in alerts. Users can create custom alerts based on price crossing session levels using TradingView's alert functionality.
⚠️ Disclaimer
Trading involves significant risk, and many participants may incur losses. The content on this site is not intended as financial advice and should not be interpreted as such. Decisions to buy, sell, hold, or trade securities, commodities, or other financial instruments carry inherent risks and are best made with guidance from qualified financial professionals. Past performance is not indicative of future results.
The Quadratic Killzones indicator is a specialized tool for visualizing key trading sessions and their price ranges divided into quadrants.
These session ranges are significant because they help traders identify potential support and resistance zones based on session highs and lows. The indicator tracks multiple sessions (Asia, London Open, NY AM, NY Lunch, NY PM) and displays their price ranges with quadrant levels (0%, 25%, 50%, 75%, 100%).
- Session Visualization: Boxes and lines highlight trading session ranges directly on the chart.
- Quadrant Levels: Price ranges are divided into quadrants for precise level identification.
- Level Invalidation: Lines extend until price invalidates the level, providing dynamic support/resistance tracking.
Session highs and lows serve as key reference points for intraday traders. The quadrant divisions help identify premium (above 50%) and discount (below 50%) zones within each session's range.
📦 Features
Key features of the indicator include:
- Multi-Session Support: Track up to 6 different sessions (Asia, London Open, NY AM, NY Lunch, NY PM, Custom).
- Quadrant Division: Session ranges divided into 0%, 25%, 50%, 75%, and 100% levels.
- Level Invalidation: Lines automatically terminate when price invalidates the level.
- Session Boxes: Visual boxes showing the session range with optional session name labels.
- Customizable Styling: Configurable colors, line styles, and display options per session.
- Time Dividers: Optional vertical dividers at specified timeframe intervals.
⚙️ Settings
History
- Sessions: Number of historical sessions to display (1-10).
Session Settings (First through Fifth + Custom)
- Show: Toggle visibility of each session.
- Name: Custom label for the session (AS, LO, NYAM, NYLA, NYPM).
- Time: Session time range in 24-hour format.
- Color: Color for the session's boxes and lines.
Styles
- Lines: Line style (solid, dashed, dotted).
- Line Width: Thickness of the lines (1-4).
- Show Box: Display session range as a box.
- Show Labels: Display high/low labels at line endpoints.
- Show Session Name: Display session name inside the box.
- Show Quadrant Lines: Display 25% and 75% quadrant levels.
- Show Percentage Labels: Display percentage labels (0%, 25%, 50%, 75%, 100%).
Dividers
- Show: Toggle vertical time dividers.
- Timeframe: Interval for divider lines.
- Style: Divider line style.
- Width: Divider line thickness.
- Color: Divider line color.
- Extend: Extend dividers to chart edges.
🌟 Benefits
Why use Quadratic Killzones over standard session indicators?
- Granularity: The quadratic division (0%, 25%, 50%, 75%, 100%) allows you to identify "Premium" and "Discount" pricing within a specific session's range, offering more precision than simple High/Low markers.
- Clean Charts: The "Level Invalidation" feature automatically stops drawing lines once price breaks them. This keeps your chart clean and focused only on active, defended levels.
- Time Alignment: With the "New York Midnight" setting, you ensure your session data is aligned with the true institutional trading day, regardless of your broker's server time.
- Structure Identification: Quickly spot when a session range is being respected (ranging/consolidation) or broken (expansion/trend).
⚡️ Showcase
Session Boxes
Session Boxes with Quadrants
Session Boxes with Labels
Session Deviders
Multiple Sessions
🚨 Alerts
This indicator does not include built-in alerts. Users can create custom alerts based on price crossing session levels using TradingView's alert functionality.
⚠️ Disclaimer
Trading involves significant risk, and many participants may incur losses. The content on this site is not intended as financial advice and should not be interpreted as such. Decisions to buy, sell, hold, or trade securities, commodities, or other financial instruments carry inherent risks and are best made with guidance from qualified financial professionals. Past performance is not indicative of future results.
Skrip sumber terbuka
Dalam semangat TradingView sebenar, pencipta skrip ini telah menjadikannya sumber terbuka, jadi pedagang boleh menilai dan mengesahkan kefungsiannya. Terima kasih kepada penulis! Walaupuan anda boleh menggunakan secara percuma, ingat bahawa penerbitan semula kod ini tertakluk kepada Peraturan Dalaman.

🔵 Tools that give you the edge: candelacharts.com/.
🔵 Join our free discord for updates: candelacharts.com/community
🔵 Join our free discord for updates: candelacharts.com/community
Penafian
Maklumat dan penerbitan adalah tidak bertujuan, dan tidak membentuk, nasihat atau cadangan kewangan, pelaburan, dagangan atau jenis lain yang diberikan atau disahkan oleh TradingView. Baca lebih dalam Terma Penggunaan.
Skrip sumber terbuka
Dalam semangat TradingView sebenar, pencipta skrip ini telah menjadikannya sumber terbuka, jadi pedagang boleh menilai dan mengesahkan kefungsiannya. Terima kasih kepada penulis! Walaupuan anda boleh menggunakan secara percuma, ingat bahawa penerbitan semula kod ini tertakluk kepada Peraturan Dalaman.
🔵 Tools that give you the edge: candelacharts.com/.
🔵 Join our free discord for updates: candelacharts.com/community
🔵 Join our free discord for updates: candelacharts.com/community
Penafian
Maklumat dan penerbitan adalah tidak bertujuan, dan tidak membentuk, nasihat atau cadangan kewangan, pelaburan, dagangan atau jenis lain yang diberikan atau disahkan oleh TradingView. Baca lebih dalam Terma Penggunaan.