OPEN-SOURCE SCRIPT
Telah dikemas kini Wyckoff Elite - Multi Structure par GUIROA Stephane
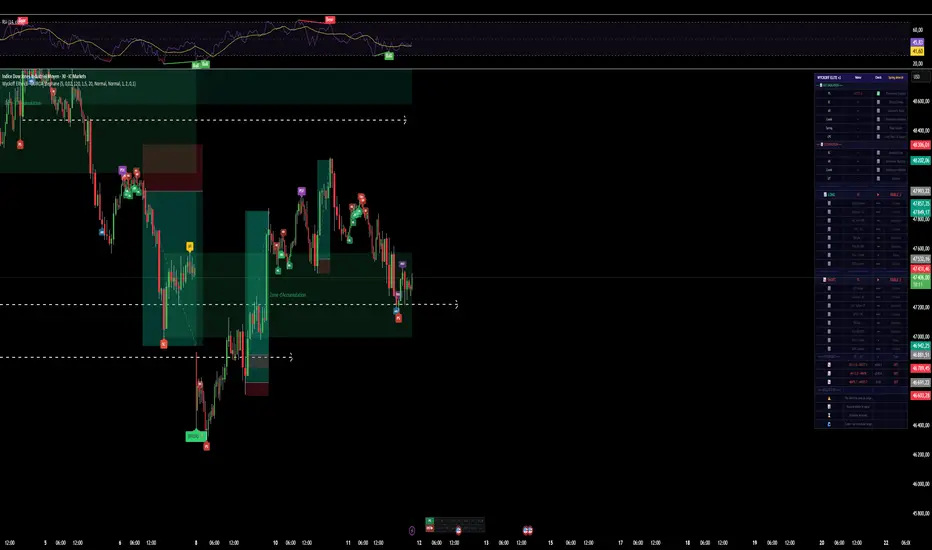
The indicator aims to identify the chronological stages of an accumulation:
PS (Preliminary Support): The first point where significant buying begins to slow the price decline.
SC (Selling Climax): The peak of panic selling, often marking the major low.
AR (Automatic Rally): A rapid technical correction triggered by short covering.
ST (Secondary Test): The price returns to test the SC zone to verify if supply has decreased.
SPRING: A temporary break below the support level (SC) to trap the last sellers before the reversal.
LPS (Last Point of Support): A low higher than the SC, signaling that buyers are now in control.
SOS (Sign of Strength): The price breaks above the AR resistance, confirming the exit from the accumulation zone.
Shutterstock
Explorer
⚙️ Technical Functioning
Pivot Accuracy: The indicator uses a depth parameter to filter noise. The higher this number, the more significant the detected points (but with a greater delay).
Secondary Test Tolerance: For the Secondary Test to be validated, the price must return to a distance close to the Support Level (configurable via the tolerance).
Duration Management: If a structure takes too long to form (maxBars), the indicator automatically resets to avoid drawing outdated patterns.
Dynamic Visualization: Horizontal dashed lines are drawn on the Support Level and the Resistance Level to visualize the Trading Range (the area of sideways movement).
PS (Preliminary Support): The first point where significant buying begins to slow the price decline.
SC (Selling Climax): The peak of panic selling, often marking the major low.
AR (Automatic Rally): A rapid technical correction triggered by short covering.
ST (Secondary Test): The price returns to test the SC zone to verify if supply has decreased.
SPRING: A temporary break below the support level (SC) to trap the last sellers before the reversal.
LPS (Last Point of Support): A low higher than the SC, signaling that buyers are now in control.
SOS (Sign of Strength): The price breaks above the AR resistance, confirming the exit from the accumulation zone.
Shutterstock
Explorer
⚙️ Technical Functioning
Pivot Accuracy: The indicator uses a depth parameter to filter noise. The higher this number, the more significant the detected points (but with a greater delay).
Secondary Test Tolerance: For the Secondary Test to be validated, the price must return to a distance close to the Support Level (configurable via the tolerance).
Duration Management: If a structure takes too long to form (maxBars), the indicator automatically resets to avoid drawing outdated patterns.
Dynamic Visualization: Horizontal dashed lines are drawn on the Support Level and the Resistance Level to visualize the Trading Range (the area of sideways movement).
Nota Keluaran
📊 Wyckoff Elite v3 – OverviewThis indicator is an advanced technical analysis tool that automates the detection of Wyckoff cycles (Accumulation, Distribution, Re-Accumulation) on any financial asset (stocks, crypto, forex, etc.). It combines Richard Wyckoff's theory with volume filters (VSA) and a scoring system to provide objective entry/exit signals.
🎯 Main Objective
The indicator aims to:
Automatically identify accumulation phases (buying by large traders) and distribution phases (selling)
Detect key inflection points (Spring, LPS, UT, LPSY, etc.)
Provide a confidence score (0-100%) to validate the signal's quality
Generate alerts and automatic Take Profit/Stop Loss levels
Display a comprehensive dashboard with all real-time information
🔍 Detailed Features
1. Wyckoff Structure Detection
Phase Events Detected Meaning
Accumulation PS → SC → AR → ST → SPRING → LPS → SOS Preparation for an upward move
Distribution PSY → BC → AR → UT → LPSY → SOW Preparation for a move Bearish
Re-Accumulation SC2 → AR2 → LPS2 → SOS2 Bullish pause in a trend
2. Advanced Filters
Volume Filter: Validation of signals with volume spikes (configurable)
VSA (Volume Spread Analysis): Detection of:
NS (No Supply) – Absence of sellers
ND (No Demand) – Absence of buyers
ABS (Absorption) – Strong hands absorbing supply
DIST (Hidden Distribution) – Discreet selling
3. Scoring System (Checklist)
LONG Score based on 9 criteria (Spring, Volume, LPS, RSI, VSA, Creek, SOS...)
SHORT Score based on 9 criteria (UT, Volume, LPSY, RSI, VSA, Creek, SOW...)
Thresholds: <45% (low), 45-74% (medium) ≥75% (Strong Signal)
4. Visual Elements
✅ Colored Range Boxes (Accumulation in Green, Distribution in Red)
✅ Support/Resistance Lines and Creek (Range Median)
✅ Automatic Entry Arrows when Score ≥75%
✅ Explanatory Labels (PS, SC, SPRING, etc.)
✅ Progress Bar at the Bottom to Track Phase Progress
✅ Background Colored According to the Active Phase
5. Risk Management
Automatic Calculation of:
TP1 (Take Profit 1): +100% of the Range Amount
TP2: +200% of the Amount
SL (Stop Loss): -30% of the Amount
Horizontal Lines Displayed After an SOS or SOW
6. Interactive Dashboard (Top Right)
Displays in Real Time:
PS, SC, AR Levels, Creek, LPS (for LONG)
BC, AR, Creek, UT, LPSY (for SHORT) levels
Scores and their interpretation
History of the last 3 patterns
The golden rules of Wyckoff trading
7. Customizable alerts
Spring detected
SOS (Sign of Strength)
Upthrust detected
SOW (Sign of Weakness)
LONG entry (score ≥75%)
SHORT entry (score ≥75%)
⚙️ Key parameters
Group Parameter Role
Plot Accuracy Pivots (5) Sensitivity for detecting highs/lows
ST/UT tolerance (0.02) Margin for Spring/Upthrust
Max duration (120) Timeout for resetting a phase
Volume Volume multiplier (1.5x) High volume threshold
VSA period (20) Moving average of Volume/Spread
Visual Boxes, Background, Checklist Activation of graphic elements
Text size Display adjustment
TP/SL TP1 (1.0x), TP2 (2.0x), SL (0.3x) Ratios relative to range
🧠 Underlying trading logic
The indicator follows the Wyckoff philosophy:
Accumulation phase: Large traders buy discreetly
PS → First support
SC → Selling climax (maximum volume)
AR → Technical rebound
ST → Support test
SPRING → Bearish trap (false breakout)
LPS → Last support point before breakout
SOS → Strength signal (entry)
Distribution phase: Large traders sell
PSY → First resistance
BC → Buying climax
AR → Technical Reaction
UT → Bullish Trap (False Breakout)
LPSY → Last Resistance Point Before Breakout
SOW → Weakness Signal (Entry)
💡 Practical Use
🔴 For a LONG trade
Wait for a SPRING (green label)
Check the LONG score (≥75% in the dashboard)
Enter on LPS or at the green arrow
Place SL below the SC, TP on the calculated lines
🔵 For a SHORT trade
Wait for a UT (red label)
Check the SHORT score (≥75%)
Enter on LPSY or at the red arrow
Place SL above the BC
📌 Tips
Do not trade within the range (between SC and AR)
Wait for a retest after a breakout
Prioritize signals with high volume
Use the dashboard to confirm The convergence of criteria
✅ Advantages
Complete automation of Wyckoff theory
Objectivity through scoring
Adaptable to all timeframes
Clear and intuitive interface
Alerts to ensure you don't miss anything
Skrip sumber terbuka
Dalam semangat TradingView sebenar, pencipta skrip ini telah menjadikannya sumber terbuka, jadi pedagang boleh menilai dan mengesahkan kefungsiannya. Terima kasih kepada penulis! Walaupuan anda boleh menggunakan secara percuma, ingat bahawa penerbitan semula kod ini tertakluk kepada Peraturan Dalaman.

Penafian
Maklumat dan penerbitan adalah tidak bertujuan, dan tidak membentuk, nasihat atau cadangan kewangan, pelaburan, dagangan atau jenis lain yang diberikan atau disahkan oleh TradingView. Baca lebih dalam Terma Penggunaan.
Skrip sumber terbuka
Dalam semangat TradingView sebenar, pencipta skrip ini telah menjadikannya sumber terbuka, jadi pedagang boleh menilai dan mengesahkan kefungsiannya. Terima kasih kepada penulis! Walaupuan anda boleh menggunakan secara percuma, ingat bahawa penerbitan semula kod ini tertakluk kepada Peraturan Dalaman.
Penafian
Maklumat dan penerbitan adalah tidak bertujuan, dan tidak membentuk, nasihat atau cadangan kewangan, pelaburan, dagangan atau jenis lain yang diberikan atau disahkan oleh TradingView. Baca lebih dalam Terma Penggunaan.