OPEN-SOURCE SCRIPT
c-c/MA (Simplified 2-Color)
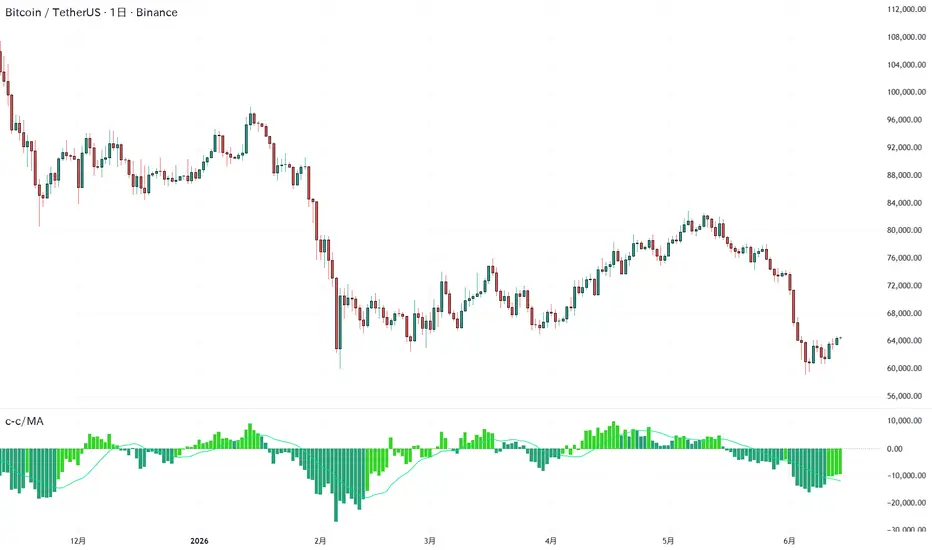
c-c/MA (Simplified 2-Color)
This indicator is a simple momentum analysis tool that visualizes price movement by comparing the current price with the price from a specified number of periods ago.
It displays the price difference as a histogram and applies a Simple Moving Average (SMA) to help identify trend strength and momentum shifts.
Features
Price Difference (c-c)
The indicator calculates the difference between the current closing price and the closing price from a specified number of bars ago:
* Positive values indicate that the current price is higher than the past price.
* Negative values indicate that the current price is lower than the past price.
SMA Smoothing
A Simple Moving Average (SMA) is applied to the histogram to smooth short-term fluctuations and highlight the overall momentum trend.
Two-Color Histogram
The histogram changes color based on its relationship to the SMA:
* Above SMA: Indicates relatively stronger momentum.
* Below SMA: Indicates weaker or slowing momentum.
Zero Line
The zero line represents the point where the current price equals the price from the selected lookback period:
* Above zero: Bullish momentum.
* Below zero: Bearish momentum.
How to Use
This indicator can be used to:
* Identify trend direction
* Evaluate momentum strength
* Detect potential trend shifts
* Complement other indicators such as RSI, volume analysis, or moving averages
Note: This indicator is designed as a supporting analytical tool and should be used alongside other forms of market analysis and risk management.
This indicator is a simple momentum analysis tool that visualizes price movement by comparing the current price with the price from a specified number of periods ago.
It displays the price difference as a histogram and applies a Simple Moving Average (SMA) to help identify trend strength and momentum shifts.
Features
Price Difference (c-c)
The indicator calculates the difference between the current closing price and the closing price from a specified number of bars ago:
* Positive values indicate that the current price is higher than the past price.
* Negative values indicate that the current price is lower than the past price.
SMA Smoothing
A Simple Moving Average (SMA) is applied to the histogram to smooth short-term fluctuations and highlight the overall momentum trend.
Two-Color Histogram
The histogram changes color based on its relationship to the SMA:
* Above SMA: Indicates relatively stronger momentum.
* Below SMA: Indicates weaker or slowing momentum.
Zero Line
The zero line represents the point where the current price equals the price from the selected lookback period:
* Above zero: Bullish momentum.
* Below zero: Bearish momentum.
How to Use
This indicator can be used to:
* Identify trend direction
* Evaluate momentum strength
* Detect potential trend shifts
* Complement other indicators such as RSI, volume analysis, or moving averages
Note: This indicator is designed as a supporting analytical tool and should be used alongside other forms of market analysis and risk management.
Skrip sumber terbuka
Dalam semangat TradingView sebenar, pencipta skrip ini telah menjadikannya sumber terbuka, jadi pedagang boleh menilai dan mengesahkan kefungsiannya. Terima kasih kepada penulis! Walaupuan anda boleh menggunakan secara percuma, ingat bahawa penerbitan semula kod ini tertakluk kepada Peraturan Dalaman.

Penafian
Maklumat dan penerbitan adalah tidak bertujuan, dan tidak membentuk, nasihat atau cadangan kewangan, pelaburan, dagangan atau jenis lain yang diberikan atau disahkan oleh TradingView. Baca lebih dalam Terma Penggunaan.
Skrip sumber terbuka
Dalam semangat TradingView sebenar, pencipta skrip ini telah menjadikannya sumber terbuka, jadi pedagang boleh menilai dan mengesahkan kefungsiannya. Terima kasih kepada penulis! Walaupuan anda boleh menggunakan secara percuma, ingat bahawa penerbitan semula kod ini tertakluk kepada Peraturan Dalaman.
Penafian
Maklumat dan penerbitan adalah tidak bertujuan, dan tidak membentuk, nasihat atau cadangan kewangan, pelaburan, dagangan atau jenis lain yang diberikan atau disahkan oleh TradingView. Baca lebih dalam Terma Penggunaan.