OPEN-SOURCE SCRIPT
COT: Noncommercial Net (Futures)
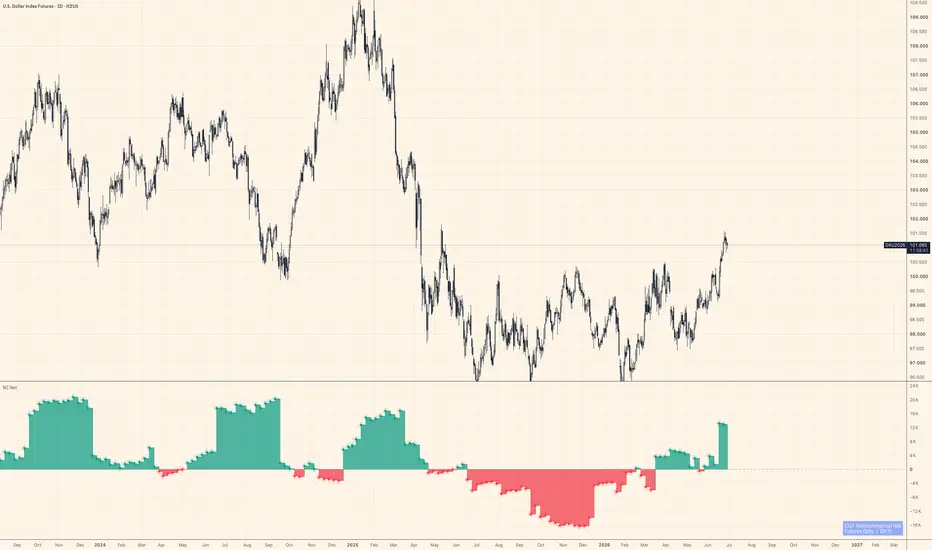
The CFTC publishes Commitment of Traders data every Friday. Inside that report, the "Noncommercial" category — large speculators, managed money, trend-followers — is the one most traders actually want to watch. This script strips everything else away and shows their net stance: Long minus Short, futures contracts only.
Positive values mean large speculators are net long. Negative means net short. A move across zero often marks a meaningful shift in positioning, not just noise.
How it works
The indicator auto-detects the correct CFTC code from the chart's symbol using TradingView's official LibraryCOT, so you don't need to configure anything. Open it on BTC futures, gold, crude oil, the yen — it resolves the code and pulls the right data automatically.
A teal/red histogram shows whether net positioning is positive or negative. A step-line sits on top for precise bar-by-bar reading. Zero is marked with a dashed reference line.
What it doesn't do
It doesn't tell you when to buy or sell. COT data is released weekly and lags several days behind the reporting cutoff — it's positioning context, not a signal. Use it alongside price action and other tools to understand who is leaning which way, not as a standalone trigger.
Notes
Futures only (not futures + options combined)
Noncommercial Long − Noncommercial Short = Net
Data source: CFTC Legacy report via TradingView's LibraryCOT v6
Works on any symbol that has a CFTC code in TradingView's database
Not financial advice. Position sizing and risk management are your responsibility.
Positive values mean large speculators are net long. Negative means net short. A move across zero often marks a meaningful shift in positioning, not just noise.
How it works
The indicator auto-detects the correct CFTC code from the chart's symbol using TradingView's official LibraryCOT, so you don't need to configure anything. Open it on BTC futures, gold, crude oil, the yen — it resolves the code and pulls the right data automatically.
A teal/red histogram shows whether net positioning is positive or negative. A step-line sits on top for precise bar-by-bar reading. Zero is marked with a dashed reference line.
What it doesn't do
It doesn't tell you when to buy or sell. COT data is released weekly and lags several days behind the reporting cutoff — it's positioning context, not a signal. Use it alongside price action and other tools to understand who is leaning which way, not as a standalone trigger.
Notes
Futures only (not futures + options combined)
Noncommercial Long − Noncommercial Short = Net
Data source: CFTC Legacy report via TradingView's LibraryCOT v6
Works on any symbol that has a CFTC code in TradingView's database
Not financial advice. Position sizing and risk management are your responsibility.
Skrip sumber terbuka
Dalam semangat TradingView sebenar, pencipta skrip ini telah menjadikannya sumber terbuka, jadi pedagang boleh menilai dan mengesahkan kefungsiannya. Terima kasih kepada penulis! Walaupuan anda boleh menggunakan secara percuma, ingat bahawa penerbitan semula kod ini tertakluk kepada Peraturan Dalaman.

If you've ever wondered why gold and Bitcoin sometimes move with dollar liquidity and sometimes don't, that's basically all I post about here — Fed balance sheet, funding stress, and stablecoin flows, read against price.
Penafian
Maklumat dan penerbitan adalah tidak bertujuan, dan tidak membentuk, nasihat atau cadangan kewangan, pelaburan, dagangan atau jenis lain yang diberikan atau disahkan oleh TradingView. Baca lebih dalam Terma Penggunaan.
Skrip sumber terbuka
Dalam semangat TradingView sebenar, pencipta skrip ini telah menjadikannya sumber terbuka, jadi pedagang boleh menilai dan mengesahkan kefungsiannya. Terima kasih kepada penulis! Walaupuan anda boleh menggunakan secara percuma, ingat bahawa penerbitan semula kod ini tertakluk kepada Peraturan Dalaman.
If you've ever wondered why gold and Bitcoin sometimes move with dollar liquidity and sometimes don't, that's basically all I post about here — Fed balance sheet, funding stress, and stablecoin flows, read against price.
Penafian
Maklumat dan penerbitan adalah tidak bertujuan, dan tidak membentuk, nasihat atau cadangan kewangan, pelaburan, dagangan atau jenis lain yang diberikan atau disahkan oleh TradingView. Baca lebih dalam Terma Penggunaan.