Trading Suite [AGPro Series]
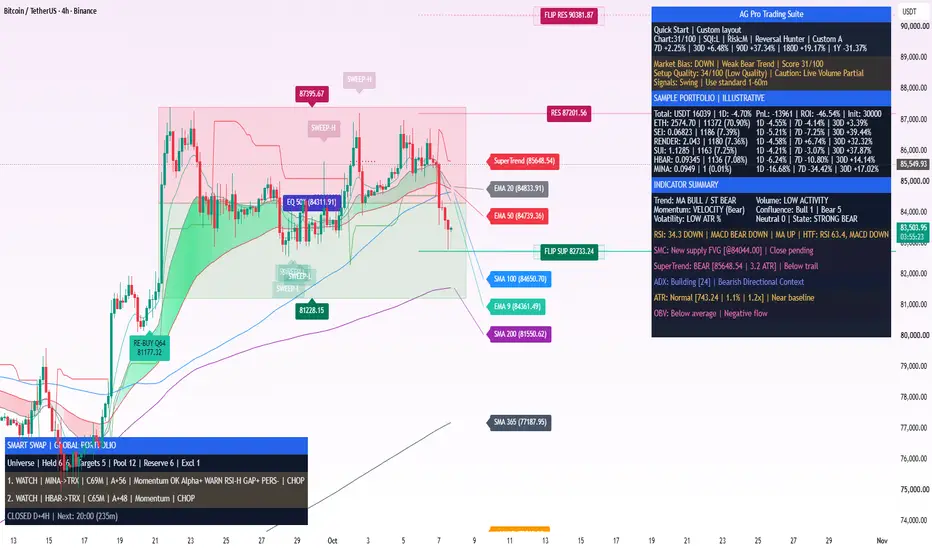
🧠 Core Idea
What if one chart could organize market structure, directional context, risk framing, portfolio awareness, and rotation discipline without pretending to predict the next move?
📌 Overview / What it does
Trading Suite is a multi-module market analysis workflow built for discretionary traders who want several layers of chart context organized inside one coherent interface. Instead of treating trend, structure, momentum, volatility, support and resistance, risk, and portfolio rotation as unrelated observations, the script arranges them into a shared analytical framework.
The suite can display a trend ribbon, selected moving averages, anchored and session VWAP references, premium/discount value zones, automatic support and resistance, liquidity and structure drawings, confirmed directional markers, scenario-based risk blocks, a compact market dashboard, a sample or custom portfolio monitor, and Smart Swap rotation states. Each module can be enabled, disabled, or simplified so the chart can remain focused rather than becoming a collection of disconnected overlays.
The script does not predict the future, place trades, connect to a broker, manage an account, or guarantee that a mapped level will hold. Its purpose is to structure observation: identify what the market is doing now, show where relevant reference levels sit, frame possible risk boundaries, and make conflicting evidence easier to notice.
🎯 Purpose & Design Philosophy
Trading decisions often become inconsistent when context is scattered across multiple indicators, timeframes, watchlists, and mental checklists. A trader may see momentum in one direction, higher-timeframe structure in another, nearby liquidity on both sides, and a portfolio rotation idea that is not supported by the current market regime.
Trading Suite was built to reduce that fragmentation. Its design philosophy is not "more signals." It is better organization of evidence.
The workflow is intended for traders who prefer to:
• Separate market context from trade execution
• Compare directional evidence instead of reacting to one condition
• Frame risk before treating a setup as actionable
• Distinguish confirmed states from developing intrabar information
• Monitor a portfolio basket without presenting it as a verified track record
• Recognize HOLD, WAIT, RISK-OFF, or low-confidence conditions as valid analytical outcomes
The interface is deliberately modular. A clean default view can be used for routine analysis, while advanced structure, liquidity, portfolio, and rotation tools can be opened when the workflow requires more depth.
⚡ Why This Script Is Different
Many chart tools focus on a single output: a crossover, a trend color, an oscillator threshold, a support line, or a BUY/SELL marker. When several such tools are stacked together, the trader still has to resolve their conflicts manually, and the result can become visually crowded without becoming analytically clearer.
Trading Suite does not treat one calculation as sufficient evidence. It combines several independent questions:
• What is the current market state?
• Is the directional context aligned across selected timeframes?
• Is price interacting with structure, liquidity, value, or volatility references?
• Does momentum support or conflict with the apparent trend?
• Where are nearby scenario boundaries and invalidation areas?
• Is a portfolio rotation candidate supported strongly enough to move beyond HOLD?
Instead of hiding disagreement, the dashboard exposes it. A bullish ribbon can coexist with weak market quality, a higher-timeframe conflict, low interest, or a risk-off Smart Swap state. This is intentional. The script is designed to make analytical friction visible before a trader turns a visual pattern into a decision.
The result is an integrated workflow rather than a collection of isolated signals.
⚙️ Methodology
1. Market State Classification
The suite evaluates trend, momentum, volatility, volume interest, and directional quality to classify the current environment. The dashboard summarizes these conditions using neutral, bullish, bearish, trending, ranging, squeeze, and quality-related states rather than relying on one binary reading.
2. Multi-Timeframe Context
Selected higher-timeframe data is evaluated to determine whether local chart conditions are supported or challenged by broader context. The higher-timeframe layer is used as a confluence and conflict filter; it is not treated as certainty.
3. Trend and Reference Mapping
The visual trend stack can combine a responsive ribbon with selected moving averages, anchored VWAP, session VWAP, and value references. These elements help separate short-term movement from broader directional structure.
4. Structure and Liquidity Evaluation
Optional Smart Money Concepts drawings identify recent or historical liquidity sweeps, fair value gaps, breaks of structure, and related market-structure events. Premium/discount zones and automatic support/resistance levels add location context to these events.
5. Directional State Transitions
BUY and SELL labels mark confirmed transitions that pass the script's internal directional and quality gates. They are state markers, not orders. The logic requires more than a simple moving-average cross and can include momentum, volume, higher-timeframe alignment, profile stability, and confirmation conditions.
6. Risk Framing
On-chart risk blocks map an analytical scenario around a detected directional state. The block can display entry context, invalidation, stop reference, and target levels. Old blocks are retired when they are no longer relevant so that the chart does not preserve stale scenarios indefinitely.
7. Portfolio and Rotation Context
The portfolio monitor calculates live values from either the illustrative sample basket or user-defined symbols and quantities. Smart Swap evaluates relative rotation candidates with confidence, persistence, friction, higher-timeframe alignment, and conflict penalties before presenting a candidate or retaining a HOLD state.
8. Visual Output
The final output is organized into three layers: chart geometry, compact state labels, and dashboard summaries. Users can keep the default view restrained or expose advanced diagnostic modules when conducting a deeper review.
🗺️ How to Read the Chart
Trend Ribbon
The green or pink ribbon represents the active directional trend state. It is a context layer, not a standalone entry signal. Ribbon transitions are more useful when interpreted alongside market quality, higher-timeframe context, momentum, and nearby structure.
Moving Averages and VWAP References
Selected SMA lines represent different trend horizons. Anchored VWAP and session VWAP provide price-location references based on the chosen anchoring logic and trading session. Their role is to show where price sits relative to longer-term and volume-weighted references.
BUY and SELL Labels
These labels identify confirmed directional state transitions. They do not mean that every subsequent bar should be traded, and they do not define position size, leverage, or account risk.
Risk Blocks, TP, and SL References
The red and green scenario block frames a directional hypothesis. The stop and target references show the geometry of that scenario. They are analytical levels generated from the script's rules, not guaranteed destinations or individualized recommendations.
Liquidity Sweeps, FVG, and BOS
Liquidity sweeps highlight price movements through relevant swing references. Fair value gaps identify selected imbalances. Break-of-structure events mark structural transitions under the active detection rules. These drawings are optional because their full historical view can become dense.
Premium and Discount Zones
Value zones divide a selected dealing range into premium and discount regions around equilibrium. They provide location context; they do not imply that price must reverse from either region.
Automatic Support and Resistance
The support and resistance engine ranks recent levels using recency, structural relevance, broken-level filtering, and multi-timeframe confluence. The default display is intentionally limited to a small number of levels on each side to preserve chart readability.
Dashboard
The dashboard summarizes directional bias, quality, market score, risk profile, timeframe context, volatility, volume interest, confluence, sample or custom portfolio values, and indicator states. Its purpose is to make agreement and disagreement visible at a glance.
Smart Swap Panel
The Smart Swap panel reports the active rotation state. It may display a qualified candidate, a watch state, a defensive state, or HOLD when the evidence does not pass the active filters.
🚦 Signals & States
• BUY → A confirmed bullish directional transition passed the active filters.
• SELL → A confirmed bearish directional transition passed the active filters.
• BULL / BEAR / NEUTRAL → The current composite directional classification.
• TRENDING / RANGING / CHOP → The current structural environment under the suite's regime logic.
• SQUEEZE / ACTIVE / CALM → A volatility-state interpretation derived from the active volatility framework.
• STRONG / WEAK / LOW INTEREST → A simplified summary of participation or supporting volume conditions.
• NOW / WAIT DIP / AGGRESSIVE / CAUTION → Timing context used to qualify a developing directional condition. These states describe setup quality and timing friction; they are not instructions.
• Smart Swap Candidate → A relative rotation candidate passed the active strategy, confidence, persistence, and conflict gates.
• WATCH → A candidate is developing but does not yet satisfy all requirements.
• HOLD → No rotation candidate currently has sufficient edge under the active filters.
• RISK-OFF / DEFENSIVE → The market or portfolio context favors caution, reduced rotation activity, or cash awareness under the selected strategy.
🔔 Alerts Logic
The suite includes alert conditions for confirmed bullish and bearish directional transitions, general directional state changes, Smart Swap confirmations, Smart Swap watch states, and HOLD status updates. Structured event messages are also available for users who maintain their own external notification workflow.
Directional alerts are designed around confirmed state transitions rather than every intrabar fluctuation. Smart Swap can separately use completed-bar data to reduce instability in rotation results. The current unfinished bar can still evolve before it closes, so users should understand whether an alert is based on a confirmed or developing state.
Alerts are attention markers. They do not place orders, size positions, manage risk, or provide trade instructions.
🧩 Confluence Logic
The suite becomes more selective when several independent layers align. A directional state may be stronger when:
• Local trend and higher-timeframe context agree
• Momentum supports the directional transition
• Volume or participation is not materially contradictory
• Market quality is above the active threshold
• Price location is coherent with structure or value context
• The selected risk profile permits the setup
• Profile switching has stabilized
• Smart Swap confidence and persistence remain above their gates
Confluence does not convert uncertainty into certainty. It simply reduces reliance on any one condition. A low score, conflict state, or HOLD result is therefore meaningful information rather than a failed signal.
📊 When to Use
Trading Suite is most useful when a trader wants a repeatable review process across several layers of context.
• Trend continuation analysis with higher-timeframe confirmation
• Pullback evaluation around moving averages, VWAP, support, or value zones
• Range and breakout review with structure and liquidity references
• Scenario planning with visible invalidation and target geometry
• Multi-timeframe market-state comparison
• Portfolio basket monitoring using sample or custom symbols
• Relative rotation review when several candidate assets compete for attention
• Post-signal review to determine whether market quality supports or contradicts a directional label
The script can be used on different liquid markets and timeframes, but settings should be interpreted in relation to the selected instrument's volatility, session behavior, and data quality.
⚠️ When NOT to Use
Avoid treating the suite as a standalone decision engine in conditions where its inputs are structurally weak or where the chart does not represent executable market conditions.
• Extremely illiquid instruments with unreliable prints or wide spreads
• Very noisy lower timeframes without sufficient data quality
• Abnormal volatility events where historical relationships can break rapidly
• Newly listed instruments with limited history
• Symbols with inconsistent exchange feeds
• Situations where position sizing, liquidity, slippage, or account constraints are unknown
• Any context in which a user expects a label or level to remove the need for independent judgment
When modules disagree, the correct interpretation may be to wait. The script intentionally supports neutral and HOLD outcomes.
🎛️ Key Inputs
Visual Modules
Users can independently control the trend ribbon, moving averages, anchored VWAP, session VWAP, directional labels, risk blocks, liquidity sweeps, FVG/BOS drawings, value zones, automatic support/resistance, dashboard, portfolio, and Smart Swap panel.
Analysis Mode and Risk Profile
These settings influence how much evidence is included and how selective the workflow becomes. A more defensive profile should not be interpreted as safer by itself; it changes the analytical thresholds, not the user's real account risk.
Coin Profile and Higher-Timeframe Data Pack
Automatic and manual profile options adapt selected parameters to the market being reviewed. The higher-timeframe pack controls which broader contexts contribute to the confluence framework.
SMC History Mode
Lite mode emphasizes recent structure and is the default for readability. Full mode draws a broader historical window and is better suited to dedicated structure review, but it can add visual density and processing load.
Maximum S/R Levels and TP Levels
The default display is restrained: two support/resistance levels per side and two target levels. Higher values provide more context but can reduce first-glance clarity.
Calculate Only on Bar Close
When enabled, the wider analytical workflow waits for completed bars. The default allows the dashboard and developing visual context to remain responsive, while confirmed directional labels and alert logic retain their own close-aware confirmation behavior.
Use Confirmed Data for Smart Swap
Enabled by default. Smart Swap rotation logic evaluates completed-bar states to reduce intrabar instability. This does not mean that all market data is immutable or that future results are known.
Realtime Refresh
Disabled by default. It can refresh selected Smart Swap information within the active bar, but it may increase calculation activity and make developing states change more often.
Smart Swap Strategy
Balanced, Reversal Hunter, Defensive Rotation, and Trend Continuation modes alter candidate ranking and filters. Balanced is the neutral default. A specialized strategy should be selected only when the user understands the behavior it emphasizes.
Basket Selection
Preset baskets cover broad market groups, while Custom Portfolio A and B allow user-defined candidate symbols. Basket selection changes the comparison universe; it does not make every included symbol suitable for rotation.
Panel and Label Controls
Panel location, theme, visibility, text size, and label density can be adjusted. The default configuration prioritizes a premium but restrained information hierarchy.
🖥️ Interface & Visual Design
The interface uses three visual priorities:
1. Price remains the primary object.
2. Scenario geometry and directional references sit above secondary diagnostics.
3. The dashboard compresses supporting evidence into a stable panel rather than scattering text across the chart.
The merged blue header identifies the suite, while dark panel rows separate market context, portfolio data, indicator summaries, and Smart Swap information. Bullish, bearish, neutral, and accent colors are used consistently across labels and states.
The pale chart theme provides a high-contrast presentation for the primary workflow, while a dark chart theme can be used without changing the analytical logic.
The full visual stack can be displayed for feature inspection, but the clean default view is recommended for routine analysis.
🧪 Practical Usage Workflow
1. Start with Market State
Read the dashboard's direction, quality, market score, volatility, volume interest, and higher-timeframe context before focusing on a label.
2. Check Location
Identify where price sits relative to the ribbon, moving averages, VWAP references, premium/discount zone, support/resistance, and recent structure.
3. Review Directional Evidence
If a BUY or SELL label is present, check whether momentum, participation, market quality, and higher-timeframe context support or conflict with it.
4. Frame the Scenario
Use the risk block, invalidation reference, support/resistance, and target geometry to understand the structure of the idea. Do not infer position size from the drawing.
5. Inspect Portfolio Context
If portfolio monitoring is enabled, distinguish live basket values from verified investment performance. In Custom mode, confirm that symbols, quantities, starting value, and cash inputs are correct.
6. Read Smart Swap Last
Treat rotation as a secondary decision layer. A candidate should not override a weak market score, a defensive state, or a HOLD result.
7. Make an Independent Decision
Apply the user's own risk limits, execution rules, liquidity checks, and broader research. The suite provides structure, not authority.
🔍 Interpretation Guidelines
Read the script as a hierarchy rather than as a vote counter.
First, determine whether the market is structurally suitable for analysis. Second, assess direction and higher-timeframe alignment. Third, evaluate location and nearby risk boundaries. Fourth, inspect whether momentum and participation confirm the idea. Finally, review Smart Swap or portfolio information only if the earlier layers are coherent.
Several common interpretations should be avoided:
• A green ribbon does not automatically mean BUY.
• A BUY label does not automatically mean favorable risk/reward.
• A target line does not predict that price will reach it.
• A support level does not guarantee a bounce.
• A Smart Swap candidate does not mean that an immediate rotation is appropriate.
• A Sample Portfolio value is not evidence of audited or historical performance.
The most valuable output can be a conflict, HOLD, WAIT, or low-quality state because it exposes when the available evidence is not coherent.
🚫 What This Script Is NOT
• It is not a price-prediction engine.
• It is not an automated trading system.
• It does not connect to a broker or exchange account.
• It does not place, modify, or close orders.
• It does not calculate personalized position size or account risk.
• It is not a guaranteed signal service.
• It is not a portfolio-management service or verified performance tracker.
• It is not financial, investment, legal, or tax advice.
⚠️ Limitations & Transparency
All rule-based market tools operate on historical and current chart data. Their outputs can change when the active bar changes, when a different exchange feed is selected, when settings are modified, or when a higher timeframe completes.
Confirmed-data options reduce selected intrabar changes; they do not make market interpretation infallible. Historical labels may look cleaner after bars have closed than the decision environment felt in real time. This is a normal limitation of chart-based analysis and should be considered during review.
Support, resistance, value zones, risk blocks, and structure drawings depend on the selected lookback, profile, timeframe, and instrument. A level can fail. A regime can change. A volatility shock can invalidate relationships that previously appeared stable.
Smart Swap compares candidates inside the selected basket. Its result depends on the symbols included, their data quality, the active strategy, thresholds, and current regime. HOLD is expected when the evidence is insufficient.
The Sample Portfolio is an illustrative live basket included to demonstrate the portfolio interface. Its symbols, quantities, value, profit/loss, and ROI fields must not be interpreted as audited results, a model account, or a recommendation to hold the same assets.
🧠 Market Context Notes
Liquidity
Liquidity is not represented by a single line. The suite uses sweep events, swing references, participation context, and nearby structure to show where liquidity may matter. These observations remain dependent on the selected market and timeframe.
Structure
Structure is treated as a sequence of recent and historical events rather than a permanent label. Breaks, sweeps, gaps, value zones, and support/resistance should be read together with the broader regime.
Volatility
Volatility affects label frequency, risk-block width, target distance, squeeze states, and the usefulness of recent references. A setting that is appropriate for one instrument may be too sensitive or too slow for another.
Portfolio Rotation
Relative strength is not the same as absolute safety. A candidate can be stronger than its basket while the broader market remains weak. The Smart Swap market gate and defensive states are intended to keep that distinction visible.
🧾 Use Case Examples
Trend Continuation Review
Price is above the responsive ribbon, higher-timeframe context is aligned, market quality is acceptable, and a pullback holds near a relevant reference. The suite may classify the condition as constructive, but the trader still evaluates invalidation, liquidity, and execution risk independently.
Range or Chop Review
The ribbon alternates, market quality falls, structure conflicts, and directional labels do not sustain. The dashboard may show RANGE, CHOP, low confidence, or HOLD. In this case, the script is identifying weak directional clarity rather than failing to produce a trade.
Liquidity Reaction Review
Price sweeps a recent swing and reacts near a value zone or support/resistance area. The trader checks whether structure, momentum, and higher-timeframe context confirm the reaction before treating it as meaningful.
Portfolio Rotation Review
One basket member improves in relative trend and momentum, but the market gate remains defensive. Smart Swap may retain HOLD or WATCH instead of presenting a confirmed candidate. This protects the analytical hierarchy: relative strength does not override broad risk context.
🧱 System Philosophy
Trading Suite is built around five principles:
• Context before direction
• Confirmation before emphasis
• Risk before targets
• Conflict before confidence
• Discipline before activity
The script is intentionally capable of saying "no clear edge." A professional workflow should not manufacture certainty merely because the chart is open.
🔐 Non-Promise Statement
No state, score, label, alert, level, target, risk block, portfolio value, or Smart Swap result guarantees a profitable outcome. The suite organizes rule-based observations from chart data; it does not know future price movement.
📉 Risk Disclosure
Trading and investing involve substantial risk, including the possible loss of capital. Market conditions can change quickly, and historical or current chart relationships may not continue. Leverage, low liquidity, slippage, fees, execution delay, and data differences can materially affect real outcomes.
This script is provided for educational and analytical purposes only. It is not financial advice, an investment recommendation, or a solicitation to buy or sell any asset. Users are solely responsible for their own research, risk limits, position sizing, execution, and decisions.
📚 Educational Note
The strongest way to use Trading Suite is as a repeatable review framework. Observe how market state, structure, momentum, volatility, location, and portfolio context interact across different instruments and timeframes. Record when the modules agree, when they conflict, and when HOLD proves more useful than activity.
The objective is not to replace judgment. It is to make judgment more structured, transparent, and consistent.
This update focuses on Smart Swap consistency, decision clarity, alert reliability, and portfolio-level data synchronization.
The core purpose of the script remains unchanged. This release improves how portfolio rotation candidates are evaluated, classified, and presented across different chart symbols and timeframes.
Trading Suite remains an analytical and visualization tool. It does not predict price direction or provide guaranteed outcomes.
------------------------
What Changed
------------------------
• Global Portfolio Context
Smart Swap evaluation is now separated from the active chart’s local technical score. Changing the chart symbol or timeframe no longer changes the portfolio regime solely because of that chart’s conditions.
• Synchronized Data Snapshot
Portfolio decisions now wait for a complete and time-aligned Daily + 4H dataset. Partial scan batches are not presented as new decisions.
• HOLD and Rotation Separation
HOLD status records are now evaluated separately from real source-to-target rotation candidates. Self-pairs can no longer occupy the primary swap-ranking position.
• Clearer Candidate Classification
The panel now distinguishes between:
• Confirmed rotation context
• Watchlist candidates
• HOLD / no-action conditions
Watchlist rows are explicitly marked as non-actionable.
• Improved Ranking Consistency
Smart Swap uses a fixed, portfolio-level candidate universe and a canonical evaluation clock to improve consistency across charts.
• HOLD Alert Reliability
The HOLD alert message builder was revised to prevent JSON formatting conflicts during conditional alert execution.
------------------------
Visual Improvements
------------------------
• Added a clearer GLOBAL PORTFOLIO identity to the Smart Swap panel
• Moved the portfolio action above the candidate list
• Added explicit WATCH and CONFIRMED classifications
• Added snapshot coverage information for easier data-readiness interpretation
• Improved separation between portfolio status and rotation candidates
------------------------
Interface & Usability
------------------------
• The primary portfolio action is now displayed before supporting candidates
• Incomplete scans show a synchronization state instead of a partial recommendation
• Watchlist candidates are labeled as informational and non-actionable
• HOLD status remains visible without overriding the ranking of real rotation pairs
------------------------
Behavior Notes
------------------------
This update does not change the script’s core chart-analysis purpose.
Smart Swap may temporarily display a synchronization message while confirmed Daily and 4H datasets are being aligned.
A candidate appearing in the watchlist does not represent a confirmed rotation or trade instruction.
------------------------
Limitations Reminder
------------------------
TradingView data availability, symbol history, exchange coverage, liquidity, and timeframe differences may affect when a complete portfolio snapshot becomes available.
Confirmed-data processing can introduce additional waiting time because developing candles are excluded from final portfolio decisions.
------------------------
Risk Reminder
------------------------
This script is intended for educational and analytical purposes only.
It does not provide financial advice, automated execution, guaranteed signals, or guaranteed outcomes.
Users remain responsible for their own analysis and decisions.
This cumulative release covers the production update from V9.2 to V9.6. It focuses on Smart Swap integrity, BUY/SELL safety, controlled re-entry, risk consistency, alert reliability and usability.
Trading Suite remains a rule-based analytical and visualization tool. It does not predict price, place orders or guarantee outcomes.
------------------------
What Changed
------------------------
• Smart Swap snapshot integrity
Actionable decisions now require complete coverage, matching timestamps, freshness and aligned completed Daily + 4H data. Partial, stale or malformed snapshots remain locked and cannot replace the last validated decision.
• Canonical portfolio decisions
The engine finalizes one decision per new valid snapshot and uses the same global portfolio state on every chart. Lower-timeframe WATCH rows remain non-actionable.
• Clear decision states
The panel separates LOCKED, HOLD, WATCH and CONFIRMED ROTATION. Incomplete data produces a safe waiting state. Confirmed rotations identify source and target while respecting caps and cooldowns.
• Cache behavior clarified
Background Cache and Frequent Cache Health Check perform refresh and recovery only. They cannot authorize developing-candle analysis or create an actionable rotation.
• BUY/SELL logic hardened
SuperTrend direction semantics were corrected. Contradictory states are vetoed, equal or missing evidence is neutral, and non-standard charts are blocked from actionable output.
Primary BUY/SELL transitions require a completed chart candle. Enabled EMA200, ADX, volume, higher-timeframe, SQI and regime filters must have valid data. Missing mandatory data pauses the signal.
• Reload and warm-up protection
Directional state is seeded silently when data becomes ready, preventing reload or cache warm-up from presenting an existing trend as a new BUY or SELL.
• Signal Strength availability repaired
Signal Strength displays N/A when mandatory SQI data is unavailable instead of showing a misleading permanent 0/100.
• Risk logic unified
Stop direction, target direction and minimum R:R are validated before a signal fires. The chart reuses the exact accepted TP/SL package. Risk handling includes ordered targets, progressive trailing, cleanup and conservative stop-first treatment of ambiguous completed candles.
• Controlled same-direction re-entry
RE-BUY and RE-SELL are separate from primary transitions. Re-entry requires an inactive prior setup, meaningful pullback, completed-candle recovery, minimum SQI, cooldown and available cycle capacity.
Strict uses SQI 70 and a 24-hour cooldown; Balanced uses SQI 60 and 12 hours; Loose uses SQI 50 and 4 hours. The default maximum is one confirmed same-direction re-entry per directional cycle.
• Alert and performance controls
Signals and Smart Swap use dedicated routing and completed-bar throttling. Position-aware states suppress conflicts. Signal Calculation History balances label coverage and TradingView load.
• Portfolio and interface updates
XRP-specific hard-coded protection was removed. The optional BTC/ETH Core Asset Shield remains user controlled. V9.6 also adds Smart Swap font sizing, individual 20/50/100/200/365 MA switches, clearer panel language and improved tooltips.
V9.6 is aligned with AGTSCore V13 and AGTSCoreUI V31.
------------------------
Behavior Notes
------------------------
Smart Swap requires a new aligned Daily + 4H snapshot. BUY/SELL uses the completed active-chart candle with enabled safety filters.
Re-entry is intentionally more selective. Fewer or later labels are expected, and a continuation without a qualifying pullback may receive none.
------------------------
Validation
------------------------
• QA round 1: 65/65 checks passed
• QA round 2: 65/65 checks passed
• TradingView live compile/save: 2 cycles passed
• Live smoke tests: 15m, 1h, 4h and 1D passed without visible errors
------------------------
Limitations & Risk
------------------------
Completed-candle confirmation and stricter validation can produce later or fewer signals. Volatility, liquidity, gaps, data quality and timeframe differences can affect output. QA and historical inspection cannot prove future profitability.
This script is for educational and analytical purposes only. It does not provide financial advice, automated execution or guaranteed trading outcomes. Users remain responsible for their own decisions.
• Refreshed the publication chart preview to better represent the current interface, signal presentation and Smart Swap safety states.
• Updated the source header from Candidate Build to Production Build.
No analytical logic, signal rules, alerts or risk calculations were changed in this publication refresh.
This update focuses on runtime resilience, clearer signal-quality communication, and cleaner right-edge chart organization.
The core purpose of Trading Suite remains unchanged.
This release improves how the existing analytical workflow is presented and protected without introducing new predictive behavior.
------------------------
What Changed
------------------------
• Safer support and resistance processing
Support/resistance confluence now skips empty collections and uses the shared valid length of each level-and-power array pair. This prevents out-of-bounds interruptions on sparse or symbol-specific datasets, including the previously observed USDTTRY case, without changing how levels are calculated.
• More accurate neutral Signal Quality presentation
When the final directional score remains inside the neutral 46–54 range, the panel now displays N/A (No Active Signal) instead of presenting a calculated zero as an active Low Quality signal. Genuine bullish or bearish contexts with low SQI values remain visible numerically.
• Stronger TP and SL badge contrast
TP1–TP5 badges now use a deeper teal background, while the SL badge uses a deeper rose background. White badge text is retained. Risk/reward zones, target and stop levels, and all related calculations remain unchanged.
• Better SUP and RES label separation
SUP and RES badges now use a balanced right-edge lane to reduce overlap with moving-average, SuperTrend, TP, and SL labels. Their horizontal position also refreshes immediately during the live bar. S/R lines, zones, strength calculations, and vertical stacking remain unchanged.
• Independent Smart Swap panel placement
The Smart Swap panel now has its own position setting and defaults to the bottom-right corner. Moving the main dashboard no longer forces Smart Swap into the opposite corner, allowing a cleaner top-left dashboard and bottom-right decision-panel layout.
• Cleaner default chart presentation
The SuperTrend line is now hidden by default to reduce visual congestion. Users can re-enable it at any time from the script settings. SuperTrend calculations and panel context remain active.
------------------------
Visual Improvements
------------------------
• Improved TP/SL badge readability on both light and dark chart themes
• Reduced right-edge label congestion while keeping SUP and RES context visible
• Refined chart hierarchy so price structure, risk zones, and primary labels remain easier to scan
• Reduced default overlay density by making the SuperTrend line optional on first load
• Preserved the established Trading Suite panel, color system, zones, and overall visual identity
------------------------
Interface & Usability
------------------------
• Neutral SQI states are now communicated as inactive context rather than weak active signals
• Active low-quality readings remain visible so genuine weak setups are not hidden
• SUP and RES badges update their selected right-edge position without waiting for a new candle
• Main dashboard and Smart Swap panel positions can now be configured independently
• The SuperTrend visibility control remains available in the existing settings workflow
• Smart Swap continues to default to the bottom-right position
------------------------
Behavior Notes
------------------------
This update does not change the core analytical engine, signal thresholds, alerts, portfolio logic, Smart Swap workflow, S/R level calculations, or risk calculations.
The S/R safety guard only prevents invalid array access when no valid level-and-power pair exists.
The SQI refinement changes display interpretation for neutral contexts; it does not alter the underlying score calculation.
Users should interpret active outputs as before, with clearer neutral-state communication and improved visual organization.
------------------------
Limitations Reminder
------------------------
Trading Suite remains a rule-based analytical and visualization tool.
Market conditions such as volatility, liquidity, timeframe differences, and data availability may affect how signals and levels appear.
Outputs should always be interpreted within broader market context.
------------------------
Risk Reminder
------------------------
This script is for educational and analytical purposes only.
It does not provide financial advice, automated execution, or guaranteed trading outcomes.
Users remain responsible for their own decisions.
• Corrected portfolio valuation so current asset prices are used instead of the previous confirmed daily close.
• Portfolio asset values, weights, total value, PnL, ROI, and 24-hour / 7-day changes now refresh from the current daily market price.
• Smart Swap confirmed-snapshot logic, signal scoring, portfolio quantities, AGTSCore 13, and AGTSCoreUI 31 remain unchanged.
This is a focused portfolio-monitoring hotfix. It does not change the script's analytical or signal logic.
This release strengthens decision reliability, confirmed-data consistency, BUY/SELL history coverage, Smart Swap continuity, portfolio transparency, and chart readability.
------------------------
What Changed
------------------------
• BUY/SELL reliability
Strict remains the new-instance default; “Balanced (Default)” was corrected to “Balanced”. Signal thresholds were not reduced. Macro, HTF/SQI, and rolling AVWAP request depth now scales with the selected bounded history window.
• Cross-timeframe Strict context
Strict can use completed Daily macro context on Weekly/Monthly charts only when required sources are available and time-aligned. Missing or stale inputs remain fail-closed.
• Smart Swap synchronization
Smart Swap now runs on a confirmed Daily + 4H clock. Required price, score, history, support, BTC, and macro data must be complete, fresh, and synchronized. Partial packages remain LOCKED.
• Rotation safeguards
HODL, same-asset, unknown-grade, below-grade, or incomplete candidates cannot become confirmed rotations. Decision safeguards now align across the engine, panel, and alerts. Exact symbol handling prevents ETHFI, WETH, or WBTC from being treated as ETH or BTC.
• Alert-state improvements
WATCH is explicitly non-actionable, and finalized-state checks reduce repeated events. Smart Swap timing and fields changed: recreate its alerts/webhooks after updating and use “Any alert() function call” for dynamic events.
• Portfolio transparency
The illustrative Sample Portfolio was refreshed and its displayed reference initial value changed from $40,000 to $5,000. It is not verified cost basis or performance. Incomplete Custom Portfolio data now shows unavailable states instead of partial totals.
• Dependencies
This version requires AGTS Core V15 and AGTS CoreUI V35, replacing Core V13 and CoreUI V31.
------------------------
Visual & Interface Improvements
------------------------
• Added “WHERE DO TREND, STRUCTURE AND RISK ALIGN?” below the merged blue title row.
• Split the Smart Swap lead decision into two compact rows and changed explanatory text to mixed case while preserving uppercase state tokens.
• Context Header Row 3 defaults OFF and remains available in Settings.
• Dashboard basket names are shortened to “Custom A/B”; full names remain in Settings.
• Core Asset Shield is optional and defaults OFF on fresh/reset instances.
• Renamed “Swap Only” to “Swap Focus”, restored portfolio reading order, standardized 1D/7D periods, and refined drawing placement and contrast.
------------------------
Behavior Notes
------------------------
BUY/SELL still requires a completed candle, ready data, trend and momentum agreement, confirmed HTF context, persistence, valid risk geometry, and minimum R:R.
Same-direction re-entries still require reset, pullback, renewed impulse, SQI, cooldown, and re-entry-cap confirmation.
After updating, verify BUY/SELL Strictness, Analysis Mode, Core Asset Shield, Context Header Row 3, basket selection, and alert configuration on previously saved instances.
------------------------
Limitations & Risk
------------------------
Available history depends on the symbol, exchange, requested sources, and TradingView plan.
This script does not provide financial advice, guaranteed signals, verified performance, or automated trade execution. Users remain responsible for their decisions and risk management.
This release strengthens structural context, Smart Swap universe quality, and maintainability while preserving portfolio valuation, BUY/SELL thresholds, and confirmed-data safeguards.
What Changed
• Structural S/R V2
Confirmed pivots now feed tick-safe adaptive zones, quality and freshness scoring, and break, retest, rejection, and role-reversal states.
• BUY/SELL protection
Strict signals now use decision-grade S/R for structural stops and zone-aware obstruction checks. TP ladders remain ordered and tick-safe.
• Smart Swap structural rail
A confirmed rotation now requires a qualified 4H support rail. Missing support or a later confirmed breach forces HOLD.
• Portfolio-aware universe
Holdings are preserved first; held or duplicate base assets are excluded, free slots are filled deterministically, and the panel reports Held, Targets, Pool, Reserve, and Excluded counts.
• Custom A and portfolio
Custom A is now a 12-asset priority pool with up to ten active Daily + 4H symbols. Illustrative Sample Portfolio quantities were refreshed; the $5,000 reference is unchanged.
• Modular architecture
S/R, BUY/SELL, and Smart Swap decision calculations moved to DecisionCore, reducing Main complexity without removing analytical modules.
Behavior Notes
WATCH remains non-actionable. Daily + 4H synchronization, confidence, persistence, trust, veto, friction, and structural-rail gates must all pass before CONFIRMED.
After updating, recreate Smart Swap and Structural S/R alerts. Requires AGTS Core V17, AGTS CoreUI V36, and AGTS DecisionCore V1.
This remains a rule-based analytical tool, not financial advice, automated execution, or a guarantee.
This release strengthens decision integrity across Smart Swap, BUY/SELL signals, TP/SL management, portfolio monitoring, alerts, and interface controls. The suite remains a discretionary analytical and visualization tool, while several data, calibration, lifecycle, and delivery contracts have been materially refined.
• Expanded the request-safe Smart Swap universe from 10 to 13 active symbols including holdings. Custom Portfolio A now contains 13 priority symbols, while Custom Portfolio B and all standard baskets contain 12; unused eligible symbols remain in reserve.
• Corrected Smart Swap data semantics by separating target relative-volume ratios from volume-quality scores. Relative source-target and matched BTC comparisons now share the selected confirmed Daily window, while 1D flow and trap checks remain independently defined and incomplete inputs fail closed.
• Rebuilt local Smart Swap outcome validation around exact confirmed 4H timestamps and a 72-hour evaluation horizon. A configurable cost allowance is deducted before grading results, misaligned observations are marked stale, and calibration may tighten but cannot relax the configured safety floors.
• Refined Smart Swap ranking so equal-advantage ties resolve deterministically, qualified rows sharing the same target are preserved, and an additional different-target comparator remains available. Alternatives from protected HODL sources remain WATCH-only.
• Changed the default BUY/SELL selectivity from Strict to Balanced while retaining all active completed-candle and safety gates. Strict mode now uses an independent five-factor Daily macro context and evaluates ranging setups through higher thresholds instead of rejecting every range automatically.
• Clarified Analysis Mode ownership so Swap Focus can hide optional dashboard HTF commentary without weakening mandatory BUY/SELL, Structural S/R, or SQI contexts.
• Upgraded TP/SL management into a persistent risk-package lifecycle. Hiding chart drawings is now display-only, automatic expiry is disabled by default, and active packages remain tracked until SL, the highest valid target, a confirmed reversal, a same-direction re-entry rebase, or an optional completed-candle expiry.
• Added deduplicated TP1–TP5 progress, trailing-SL advancement, terminal-target, active-SL, reversal, rebase, and expiry alert events. Same-candle lifecycle and BUY/SELL events are combined into one dynamic alert payload.
• Added independent Smart Swap panel positioning, a Minimal Swap Panel, separate dashboard slogan and Quick Start visibility controls, and clearer separation between market bias, setup quality, and blocked or caution states.
• Upgraded portfolio monitoring to a canonical 60-minute request per asset, preserved each symbol’s own minimum-tick price precision, and added 30-day performance context alongside the existing daily and 7-day views.
• Refined Smart Swap alert routing so Bulk alerts require a confirmed actionable Top-1 decision, WATCH-only changes remain display-only, optional HOLD notices use a separate path, and critical Structural S/R invalidations respect the selected message format. Existing TradingView alerts should be recreated after installing this version.
This update focuses on structural chart readability, Smart Swap data validation, and explicit portfolio and sizing boundaries. It updates version 9.8.29 while preserving the suite's purpose as a multi-module analytical and visualization tool.
This is not solely a visual revision. The data-eligibility, sizing and portfolio changes described below can affect displayed results. The script does not predict price direction, execute trades or guarantee outcomes.
------------------------
What Changed
------------------------
• Structural support/resistance display
Reworked chart-level selection to prioritize the nearest valid structure, followed by stronger distinct structures within the selected display limit. Nearby same-role candidates are consolidated using bounded grouping while retaining a representative source price. MAJOR styling distinguishes higher-scored structures; a visible level does not automatically satisfy the separate decision-quality threshold. No levels are fabricated to fill unused display slots.
• Smart Swap historical-data validation
Added timestamp alignment checks for paired Daily histories and their performance-reference observations. Invalid or incomplete ratio-momentum data is now treated as unavailable instead of receiving a neutral value. Pairs that fail these checks are excluded before ranking, so candidate availability and downstream outputs may differ from the previous version.
• Smart Swap status and diagnostics
Refined state-based panel styling and added an optional exact-pair audit showing the first failed eligibility check, pending persistence or engine-output status. Synchronization diagnostics identify the blocking symbol and Daily/4H data group. Minimal view can retain an otherwise eligible WATCH candidate without treating it as actionable.
• Refresh scheduling and alert text
Changed catch-up scheduling to a 15-second elapsed-time threshold with an immediate refresh opportunity when the expected 4H source period changes. Processing still depends on incoming chart updates and available source data; this is not a guaranteed completion time. Separated bulk-alert text construction from panel presentation and diagnostic rows. Integrations that parse bulk messages should review the revised text format.
• Explicit analytical sizing inputs
Separated Sizing Capital and Sizing Currency from portfolio totals. Size estimates require a positive budget, matching chart quote currency and a supported standard-chart spot/share unit model. Zero capital disables estimates, and Sample Portfolio mode remains excluded. No currency conversion or USD/USDT equivalence is assumed.
• USDT-only portfolio accounting
Added quote-currency validation for active holdings. Non-USDT or unavailable quote currencies make aggregate valuation, PnL, ROI and weights unavailable rather than mixing incompatible values. Native asset prices remain visible with a currency warning. Refreshed the illustrative sample from ARB/ADA with a 40,000 initial reference to ETH/ETHFI with a 30,000 USDT reference; results across these different sample baskets are not a continuous performance record.
------------------------
Visual Improvements
------------------------
• Coordinated S/R, risk and indicator badges using shared spacing and connector handling. Repositioning badges does not move their underlying price references.
• Added filled structural context badges: TEST identifies price inside the displayed zone; CHECK identifies price beyond its adverse edge, not a confirmed break; FLIP identifies a committed role reversal when current-price context does not take precedence.
• Separated chart score from macro context in the dashboard header and displayed unavailable summary inputs as N/A rather than implying a neutral observation.
------------------------
Interface & Usability
------------------------
• Added Adaptive Badge Layout and optional Swap Pair Audit controls alongside the explicit sizing inputs.
• Set the individual Stoch RSI, Ichimoku, ADX and Bollinger Bands detail options to off by default. These features remain available through their separate settings.
• Retained panel positioning, theme, visibility and font controls. Reviewed configuration is recommended after updating, particularly sizing, optional details and portfolio settings.
------------------------
Behavior Notes
------------------------
The existing confirmed Daily + 4H snapshot framework and up-to-13-symbol comparison capacity are retained; they are not new additions in this release. HOLD, WATCH and LOCKED describe different processing states and are not trade instructions.
Display selection is separate from full-depth structural decision data. Current-price context can change before candle close, and pivot-based structure requires confirmation. Data-eligibility changes can alter candidate rankings and related alerts even where downstream thresholds remain the same.
------------------------
Limitations Reminder
------------------------
Portfolio figures are a current-holdings valuation, not a transaction ledger. They do not reconstruct deposits, withdrawals, realized trades or fees. Sizing does not model leverage, liquidation, slippage or exchange order increments.
Layout depends on chart dimensions, zoom, font size and label density. No universal collision-free layout or measured speed improvement is claimed. The current build can encounter a main-body size error with Pine Profiler enabled; profiling remains unresolved. Synthetic checks do not replace full market/replay or performance validation.
------------------------
Risk Reminder
------------------------
This script is for educational and analytical purposes only. It is not financial advice or an automated trading system. Trading involves risk, no outcomes are guaranteed, and users remain responsible for their decisions.
UPDATE NOTES - 9.8.35
This update focuses on reducing repeated configuration work while preserving the existing analytical workflow and visual features. Trading Suite remains a rule-based analytical and visualization tool; it does not predict outcomes or guarantee trading results.
What Changed
• Updated the illustrative Sample Portfolio to ETH, RENDER, SEI, SUI and HBAR. Custom Portfolio inputs remain unchanged.
• Cached the dashboard row layout for each script run. The same row definitions are now reused instead of rebuilding the layout arrays on every bar and realtime update.
• Initialized the selected Smart Swap priority pool and active universe once per configuration. Holdings-first selection, duplicate handling, reserve ordering and request-capacity limits are preserved.
• Cached the configuration-based request budget and finalized basket identity. The budget still reserves every timeframe permitted by the selected settings, including optional lower-timeframe contexts that volatility may temporarily suppress.
• Consolidated the two equivalent portfolio refresh branches into one request owner. Live portfolio monitoring remains available when Calculate Only on Bar Close is enabled.
Interface & Usability
All existing display controls, themes, panel positions and font-size settings remain available. Input changes rebuild the configuration automatically. All features and analytical settings remain available. The illustrative sample holdings were refreshed.
Behavior Notes
The scoring formulas, BUY/SELL and re-entry rules, TP/SL lifecycle, Smart Swap ranking, confirmed-data safeguards and alert conditions are unchanged. Structural Support/Resistance calculations and rendering are unchanged. This release uses the same published library versions as RC23 FIX1.
Limitations Reminder
Load time depends on chart history, the selected configuration, requested market data and TradingView execution conditions. This update removes specific repeated operations; it does not promise a fixed percentage reduction in loading time. Data synchronization safeguards may temporarily keep Smart Swap locked until its required snapshots align.
Risk Reminder
This script is for educational and analytical purposes only. It does not provide financial advice or guaranteed outcomes. Trading involves risk, and users remain responsible for their decisions.
• Added an optional Intraday (1m-60m) Buy/Sell Timing Profile.
• Added chart-scaled re-entry delays and separate daily quotas for each direction.
• Added dashboard feedback for Intraday mode and Swing fallback.
• Changed the default S/R Scan Profile to Swing / Deep Scan (Wide).
• Shortened the dashboard's Intraday timeframe guidance.
- Added optional MA 9 and MA 12 lines with independent visibility controls, both off by default.
- Both periods follow the existing SMA/EMA, thickness and price-label settings.
• Fixes missing asset-performance values on weekly/monthly charts using completed Daily references and a bounded display cache.
• Shortens the context header; hides unavailable Macro data and uses compact Macro states when ready.
• Adds independent type, period and visibility controls for seven chart MAs.
• Fixes live HTF caching, bar-close refresh, Ichimoku history, Minimal Mode switches and crypto-macro readiness checks.
• Retains validated manual Swap events for bar-close alerts; clarifies active-stop information and dashboard tooltips.
• Reduces repeated Swap source calculations and hidden portfolio refreshes; moves preset baskets and Order Block drawing code into libraries.
Skrip jemputan sahaja
Hanya pengguna diluluskan oleh penulis boleh mengakses skrip ini. Anda perlu memohon dan mendapatkan kebenaran untuk menggunakannya. Selalunya ia diberikan selepas melakukan pembayaran. Untuk lebih butiran, ikuti arahan penulis di bawah atau hubungi AGProLabs secara terus.
TradingView TIDAK menyarankan pembayaran atau penggunaan skrip kecuali anda mempercayai sepenuhnya penulis dan memahami bagaimana ia berfungsi. Anda juga boleh menjumpai alternatif sumber terbuka dan percuma yang lain di dalam skrip komuniti kami.
Arahan penulis

tradingview.com/script/XJmX3p98-Trading-Suite-AGPro-Series/
Crypto Setup Planner | Multi-Symbol Analysis :
tradingview.com/script/LgVRo7Ql-Crypto-Setup-Planner-AGPro-Series/
Penafian
Skrip jemputan sahaja
Hanya pengguna diluluskan oleh penulis boleh mengakses skrip ini. Anda perlu memohon dan mendapatkan kebenaran untuk menggunakannya. Selalunya ia diberikan selepas melakukan pembayaran. Untuk lebih butiran, ikuti arahan penulis di bawah atau hubungi AGProLabs secara terus.
TradingView TIDAK menyarankan pembayaran atau penggunaan skrip kecuali anda mempercayai sepenuhnya penulis dan memahami bagaimana ia berfungsi. Anda juga boleh menjumpai alternatif sumber terbuka dan percuma yang lain di dalam skrip komuniti kami.
Arahan penulis
tradingview.com/script/XJmX3p98-Trading-Suite-AGPro-Series/
Crypto Setup Planner | Multi-Symbol Analysis :
tradingview.com/script/LgVRo7Ql-Crypto-Setup-Planner-AGPro-Series/