OPEN-SOURCE SCRIPT
Geometric Matrix Intelligence [GMI]
Description:
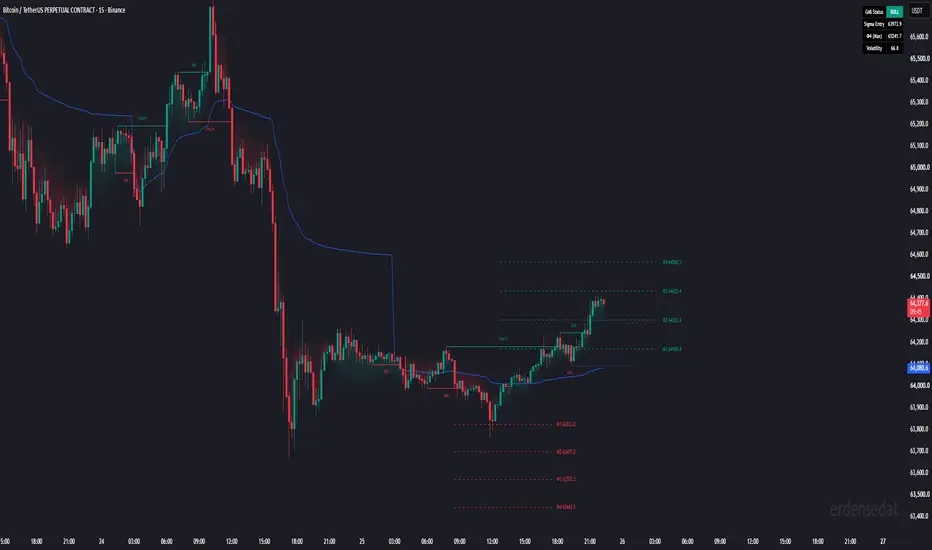
Welcome to the Geometric Matrix Intelligence [GMI] + Market Structure indicator. This script is a hybrid trading tool that merges advanced structural concepts (BOS/CHoCH) with geometric probability levels and volatility-based trend analysis.
Core Features:
Geometric Probability Levels (GMI):
When a shift in trend direction is detected based on our custom ATR volatility filter, the script automatically projects forward geometric expansion levels (Φ1 to Φ4). These levels are highly versatile:
Reversal Zones: Price often reacts directly at these mathematical levels, creating excellent pivot or bounce areas.
Take Profit (TP) Targets: Once you are in a trade, these expansion lines provide objective, dynamic targets to scale out or close your positions.
Market Structure (BOS / CHoCH):
Automatically identifies structural pivot highs and lows using a fractal length (defaulted to 12).
Plots pending "Candidate" structure lines (in blue by default).
Confirms Break of Structure (BOS) or Change of Character (CHoCH) when the price breaks these pivots, updating dynamically on your chart.
VWAP Integration:
Includes a built-in Volume Weighted Average Price (VWAP) as a primary institutional baseline to help gauge overall intraday or multi-day bias. (Enabled by default).
Interactive Trend Dashboard & Shading:
An on-chart dashboard tracks the immediate trend status, the initial trigger entry price, maximum projected targets (Φ4), and current ATR volatility.
Visual trend shading allows for immediate macro-trend recognition.
How to Use:
Watch for Market Structure shifts (BOS/CHoCH) aligning with the GMI generated levels.
Use the projected Φ levels as primary take profit targets when trading a newly confirmed structural break.
Monitor the VWAP to ensure your structural trades are on the correct side of the institutional volume average.
Disclaimer:
This script is provided for educational and informational purposes only. It is not intended to be a financial advice, investment recommendation, or a signal to buy/sell any asset. Trading in financial markets involves significant risk of loss. Always do your own research and test any indicator or strategy in a paper-trading environment before committing real capital.
Welcome to the Geometric Matrix Intelligence [GMI] + Market Structure indicator. This script is a hybrid trading tool that merges advanced structural concepts (BOS/CHoCH) with geometric probability levels and volatility-based trend analysis.
Core Features:
Geometric Probability Levels (GMI):
When a shift in trend direction is detected based on our custom ATR volatility filter, the script automatically projects forward geometric expansion levels (Φ1 to Φ4). These levels are highly versatile:
Reversal Zones: Price often reacts directly at these mathematical levels, creating excellent pivot or bounce areas.
Take Profit (TP) Targets: Once you are in a trade, these expansion lines provide objective, dynamic targets to scale out or close your positions.
Market Structure (BOS / CHoCH):
Automatically identifies structural pivot highs and lows using a fractal length (defaulted to 12).
Plots pending "Candidate" structure lines (in blue by default).
Confirms Break of Structure (BOS) or Change of Character (CHoCH) when the price breaks these pivots, updating dynamically on your chart.
VWAP Integration:
Includes a built-in Volume Weighted Average Price (VWAP) as a primary institutional baseline to help gauge overall intraday or multi-day bias. (Enabled by default).
Interactive Trend Dashboard & Shading:
An on-chart dashboard tracks the immediate trend status, the initial trigger entry price, maximum projected targets (Φ4), and current ATR volatility.
Visual trend shading allows for immediate macro-trend recognition.
How to Use:
Watch for Market Structure shifts (BOS/CHoCH) aligning with the GMI generated levels.
Use the projected Φ levels as primary take profit targets when trading a newly confirmed structural break.
Monitor the VWAP to ensure your structural trades are on the correct side of the institutional volume average.
Disclaimer:
This script is provided for educational and informational purposes only. It is not intended to be a financial advice, investment recommendation, or a signal to buy/sell any asset. Trading in financial markets involves significant risk of loss. Always do your own research and test any indicator or strategy in a paper-trading environment before committing real capital.
Skrip sumber terbuka
Dalam semangat TradingView sebenar, pencipta skrip ini telah menjadikannya sumber terbuka, jadi pedagang boleh menilai dan mengesahkan kefungsiannya. Terima kasih kepada penulis! Walaupuan anda boleh menggunakan secara percuma, ingat bahawa penerbitan semula kod ini tertakluk kepada Peraturan Dalaman.

Penafian
Maklumat dan penerbitan adalah tidak bertujuan, dan tidak membentuk, nasihat atau cadangan kewangan, pelaburan, dagangan atau jenis lain yang diberikan atau disahkan oleh TradingView. Baca lebih dalam Terma Penggunaan.
Skrip sumber terbuka
Dalam semangat TradingView sebenar, pencipta skrip ini telah menjadikannya sumber terbuka, jadi pedagang boleh menilai dan mengesahkan kefungsiannya. Terima kasih kepada penulis! Walaupuan anda boleh menggunakan secara percuma, ingat bahawa penerbitan semula kod ini tertakluk kepada Peraturan Dalaman.
Penafian
Maklumat dan penerbitan adalah tidak bertujuan, dan tidak membentuk, nasihat atau cadangan kewangan, pelaburan, dagangan atau jenis lain yang diberikan atau disahkan oleh TradingView. Baca lebih dalam Terma Penggunaan.