Crypto Liquidation Heatmap
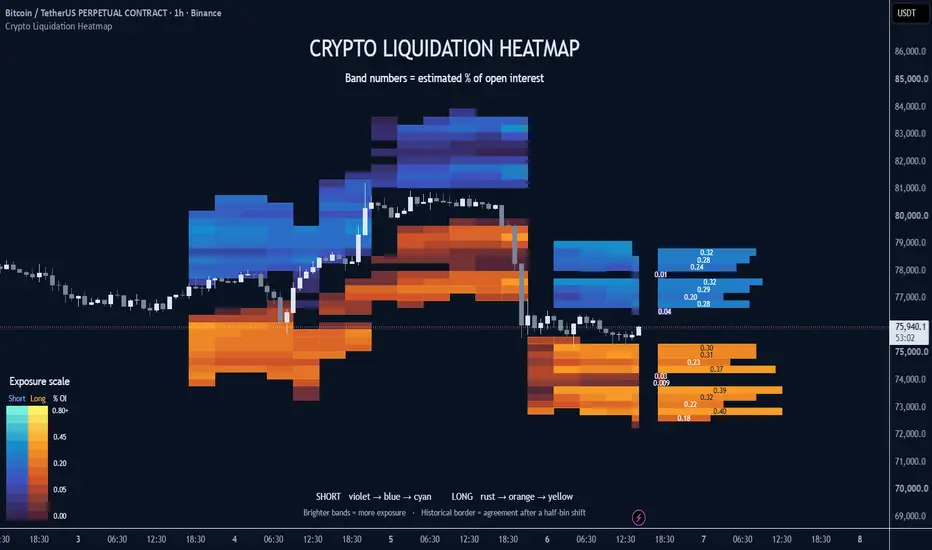
Crypto Liquidation Heatmap estimates where leveraged long and short positions could be vulnerable to liquidation. It uses changes in a contract’s open interest (OI). The bands show how concentrated the resulting estimates are within each price range.
🔷 How to use it
1. Open a standard Binance USDT perpetual candlestick chart, such as BINANCE:BTCUSDT.P or BINANCE:ETHUSDT.P. Choose an interval from 5 minutes to 1 day and add the indicator. The contract needs a matching OI feed. If the chart shows “NO ALIGNED OI,” check the symbol, exchange and interval.
2. Start at the right of the latest candle. Each horizontal band represents one price range at the last confirmed close. Read its number as a percentage of the contract’s OI. For example, 0.41 means the modeled concentration in that bin is 0.41% of OI. Larger numbers mean more estimated exposure. Leave some room to the right of price to see the full profile.
3. Use the meter to read earlier bands. Violet through blue to cyan represents shorts. Rust through orange to yellow represents longs. Both scales brighten as concentration increases. With the default settings, color reaches full strength at 0.80% of OI. The printed numbers continue above that value. Under Presentation, you can move the meter, hide the numbers or select Classic blue/orange.
4. For a longer view, switch to 12-hour or daily candles and leave History view on Auto. Below 12 hours, Auto keeps up to 18 snapshots at four-bar intervals by default. At 12 hours and above, it requests 730 days with a budget of 240 samples. On 12-hour candles that gives one regular snapshot every seven bars. Show diagnostics displays the earliest retained date, sample count and actual cadence. Available history and OI gaps affect coverage.
🔷 What a highlighted zone means
An apparently strong band can depend on the assumed leverage or on exactly where a price bin starts. This indicator checks both. It calculates three alternative leverage scenarios and repeats the grouping with price boundaries shifted by half a bin. A historical border in Recent view, or a light inset in Long history, means that at least two of the same scenarios met the concentration floor in both the original bin and one overlapping shifted bin. The default floor is 0.05% of OI per scenario. Compare these marks with band brightness to see which concentrations persist under that change.
🔷 How the estimates are built
At a confirmed close, a positive change in OI creates a group of hypothetical positions with both a long and a short side. The default leverage assumptions are 10x, 25x and 50x. Within each scenario, hypothetical entries at the candle’s low, midpoint and high receive weights of 25%, 50% and 25%. Each scenario uses the same increase in OI. The displayed concentration averages the three alternatives.
For entry price E, leverage L and maintenance margin rate m, the modeled long threshold is E × (1 − 1/L) / (1 − m). The short threshold is E × (1 + 1/L) / (1 + m). The default maintenance rate is 0.5%. On later bars, a crossing of the modeled price retires that estimate. Declining OI reduces the surviving weights proportionally. By default, weights decay with a 24-hour half-life and expire after 72 hours, with a cap of 96 growth observations. A historical snapshot preserves what the model showed at its calculation close. A gap in aligned data clears the active inventory.
🔷 Alerts and limits
Five close-confirmed alert conditions cover long or short threshold crossings, newly appearing grid-stable long or short concentrations, and loss of OI continuity. An agreement alert fires when the count for that side goes from zero to positive.
Individual entries, leverage and collateral are unavailable from net OI. The model uses a simplified isolated-margin calculation and traded candle prices. Actual liquidation engines can use mark price, account margin, fees and risk tiers. The default grid displays 24 local price bins and shows the larger side where both sides share a bin. Diagnostics reports how much modeled exposure falls within those rows. Use this map to examine assumptions and concentration. It does not measure executed liquidations or establish where price will go next.
🔷 How to use it
1. Open a standard Binance USDT perpetual candlestick chart, such as BINANCE:BTCUSDT.P or BINANCE:ETHUSDT.P. Choose an interval from 5 minutes to 1 day and add the indicator. The contract needs a matching OI feed. If the chart shows “NO ALIGNED OI,” check the symbol, exchange and interval.
2. Start at the right of the latest candle. Each horizontal band represents one price range at the last confirmed close. Read its number as a percentage of the contract’s OI. For example, 0.41 means the modeled concentration in that bin is 0.41% of OI. Larger numbers mean more estimated exposure. Leave some room to the right of price to see the full profile.
3. Use the meter to read earlier bands. Violet through blue to cyan represents shorts. Rust through orange to yellow represents longs. Both scales brighten as concentration increases. With the default settings, color reaches full strength at 0.80% of OI. The printed numbers continue above that value. Under Presentation, you can move the meter, hide the numbers or select Classic blue/orange.
4. For a longer view, switch to 12-hour or daily candles and leave History view on Auto. Below 12 hours, Auto keeps up to 18 snapshots at four-bar intervals by default. At 12 hours and above, it requests 730 days with a budget of 240 samples. On 12-hour candles that gives one regular snapshot every seven bars. Show diagnostics displays the earliest retained date, sample count and actual cadence. Available history and OI gaps affect coverage.
🔷 What a highlighted zone means
An apparently strong band can depend on the assumed leverage or on exactly where a price bin starts. This indicator checks both. It calculates three alternative leverage scenarios and repeats the grouping with price boundaries shifted by half a bin. A historical border in Recent view, or a light inset in Long history, means that at least two of the same scenarios met the concentration floor in both the original bin and one overlapping shifted bin. The default floor is 0.05% of OI per scenario. Compare these marks with band brightness to see which concentrations persist under that change.
🔷 How the estimates are built
At a confirmed close, a positive change in OI creates a group of hypothetical positions with both a long and a short side. The default leverage assumptions are 10x, 25x and 50x. Within each scenario, hypothetical entries at the candle’s low, midpoint and high receive weights of 25%, 50% and 25%. Each scenario uses the same increase in OI. The displayed concentration averages the three alternatives.
For entry price E, leverage L and maintenance margin rate m, the modeled long threshold is E × (1 − 1/L) / (1 − m). The short threshold is E × (1 + 1/L) / (1 + m). The default maintenance rate is 0.5%. On later bars, a crossing of the modeled price retires that estimate. Declining OI reduces the surviving weights proportionally. By default, weights decay with a 24-hour half-life and expire after 72 hours, with a cap of 96 growth observations. A historical snapshot preserves what the model showed at its calculation close. A gap in aligned data clears the active inventory.
🔷 Alerts and limits
Five close-confirmed alert conditions cover long or short threshold crossings, newly appearing grid-stable long or short concentrations, and loss of OI continuity. An agreement alert fires when the count for that side goes from zero to positive.
Individual entries, leverage and collateral are unavailable from net OI. The model uses a simplified isolated-margin calculation and traded candle prices. Actual liquidation engines can use mark price, account margin, fees and risk tiers. The default grid displays 24 local price bins and shows the larger side where both sides share a bin. Diagnostics reports how much modeled exposure falls within those rows. Use this map to examine assumptions and concentration. It does not measure executed liquidations or establish where price will go next.

Automate TradingView alerts to brokers no coding needed. Trade futures, forex, or crypto, copy trades across unlimited accounts, & control risk with ease.
For Tradovate: bit.ly/4a1KBrY
For all other supported brokers: bit.ly/4qEbU2G
For Tradovate: bit.ly/4a1KBrY
For all other supported brokers: bit.ly/4qEbU2G
Penafian
Maklumat dan penerbitan adalah tidak bertujuan, dan tidak membentuk, nasihat atau cadangan kewangan, pelaburan, dagangan atau jenis lain yang diberikan atau disahkan oleh TradingView. Baca lebih dalam Terma Penggunaan.
Automate TradingView alerts to brokers no coding needed. Trade futures, forex, or crypto, copy trades across unlimited accounts, & control risk with ease.
For Tradovate: bit.ly/4a1KBrY
For all other supported brokers: bit.ly/4qEbU2G
For Tradovate: bit.ly/4a1KBrY
For all other supported brokers: bit.ly/4qEbU2G
Penafian
Maklumat dan penerbitan adalah tidak bertujuan, dan tidak membentuk, nasihat atau cadangan kewangan, pelaburan, dagangan atau jenis lain yang diberikan atau disahkan oleh TradingView. Baca lebih dalam Terma Penggunaan.