ATK/DEF Power Swing - EXP Micro Swing Point
# ATK/DEF Power Swing - EXP Micro Swing Point
## Overview
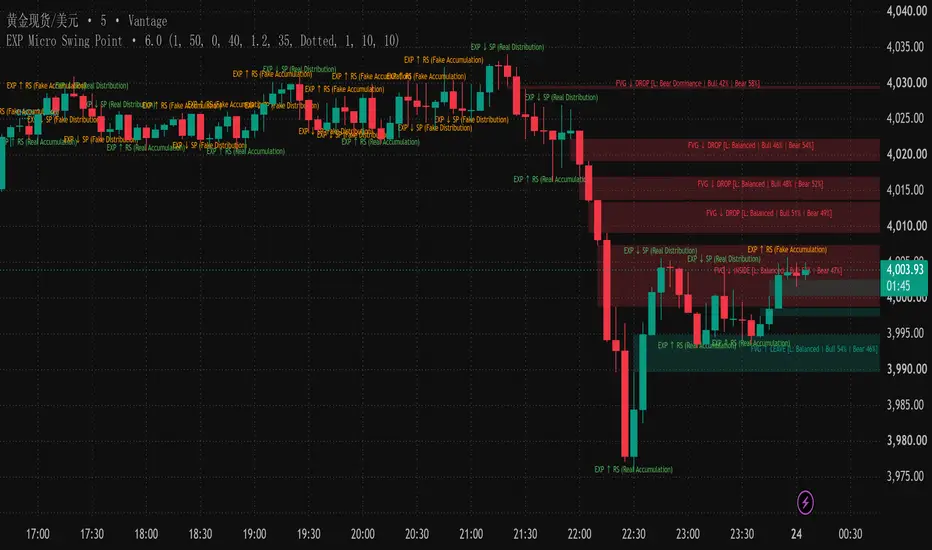
ATK/DEF Power Swing - EXP Micro Swing Point is a micro-structure analysis indicator designed to examine short-term swing points, structural breaks, EXP-based volume analysis, and Fair Value Gap (FVG) lifecycle behavior.
It combines micro swing detection, BOS / CHoCH structure references, directional candle-volume analysis, and a four-stage FVG framework in one chart-based analytical system.
## Core Features
### 1. Micro Swing Structure
- Identifies micro swing highs and lows.
- Configurable Micro Swing Length.
- Adjustable structure retention capacity.
- Displays high and low reference points associated with price structure.
### 2. EXP — Hedge & Volume Analysis
- Examines price movement between consecutive swing points.
- Combines candle-body size and volume to calculate a directional movement measure.
- Displays rule-based EXP classifications, including Real Accumulation, Fake Accumulation, Real Distribution, and Fake Distribution.
These classifications are derived from the script's calculation rules and should not be interpreted as verified institutional activity or actual order-flow data.
### 3. BOS / CHoCH Structure
- Close-based structural breakout detection.
- Distinguishes BOS and CHoCH according to the previous recorded break direction.
- Optional horizontal breakout levels.
- Independent controls for structure labels and breakout lines.
### 4. Four-Stage FVG Lifecycle
Bullish and bearish FVG zones are tracked through four stages:
- **CLIMB / DROP** — initial gap formation.
- **INSIDE** — price interacts with the gap zone.
- **LEAVE** — price closes beyond the relevant gap boundary.
- **STOP** — price closes beyond the opposite boundary of the gap.
FVG zones include configurable minimum size, extension width, color settings, and automatic cleanup when invalidated.
### 5. Directional Candle-Volume Composition
- Tracks bullish-candle and bearish-candle volume within each FVG's lifecycle.
- Displays their relative percentages.
- Classifies the composition as Bull Dominance, Bear Dominance, or Balanced using a configurable dominance threshold.
This is a candle-direction-based volume calculation, not exchange-verified buyer/seller transaction data or a direct measurement of market liquidity.
## Chart References
The following chart examples illustrate different views of the indicator:
1.
2.
3.
4.
5.
## Analysis Scope
This indicator provides visual references for examining micro swings, structural breaks, price-volume relationships, and FVG zone behavior.
Its classifications are based on programmed conditions and historical chart data. They do not guarantee future price movement and should not be treated as verified institutional positioning.
**Purpose: Market analysis and structural visualization only.**
## Overview
ATK/DEF Power Swing - EXP Micro Swing Point is a micro-structure analysis indicator designed to examine short-term swing points, structural breaks, EXP-based volume analysis, and Fair Value Gap (FVG) lifecycle behavior.
It combines micro swing detection, BOS / CHoCH structure references, directional candle-volume analysis, and a four-stage FVG framework in one chart-based analytical system.
## Core Features
### 1. Micro Swing Structure
- Identifies micro swing highs and lows.
- Configurable Micro Swing Length.
- Adjustable structure retention capacity.
- Displays high and low reference points associated with price structure.
### 2. EXP — Hedge & Volume Analysis
- Examines price movement between consecutive swing points.
- Combines candle-body size and volume to calculate a directional movement measure.
- Displays rule-based EXP classifications, including Real Accumulation, Fake Accumulation, Real Distribution, and Fake Distribution.
These classifications are derived from the script's calculation rules and should not be interpreted as verified institutional activity or actual order-flow data.
### 3. BOS / CHoCH Structure
- Close-based structural breakout detection.
- Distinguishes BOS and CHoCH according to the previous recorded break direction.
- Optional horizontal breakout levels.
- Independent controls for structure labels and breakout lines.
### 4. Four-Stage FVG Lifecycle
Bullish and bearish FVG zones are tracked through four stages:
- **CLIMB / DROP** — initial gap formation.
- **INSIDE** — price interacts with the gap zone.
- **LEAVE** — price closes beyond the relevant gap boundary.
- **STOP** — price closes beyond the opposite boundary of the gap.
FVG zones include configurable minimum size, extension width, color settings, and automatic cleanup when invalidated.
### 5. Directional Candle-Volume Composition
- Tracks bullish-candle and bearish-candle volume within each FVG's lifecycle.
- Displays their relative percentages.
- Classifies the composition as Bull Dominance, Bear Dominance, or Balanced using a configurable dominance threshold.
This is a candle-direction-based volume calculation, not exchange-verified buyer/seller transaction data or a direct measurement of market liquidity.
## Chart References
The following chart examples illustrate different views of the indicator:
1.
2.
3.
4.
5.
## Analysis Scope
This indicator provides visual references for examining micro swings, structural breaks, price-volume relationships, and FVG zone behavior.
Its classifications are based on programmed conditions and historical chart data. They do not guarantee future price movement and should not be treated as verified institutional positioning.
**Purpose: Market analysis and structural visualization only.**

Penafian
Maklumat dan penerbitan adalah tidak bertujuan, dan tidak membentuk, nasihat atau cadangan kewangan, pelaburan, dagangan atau jenis lain yang diberikan atau disahkan oleh TradingView. Baca lebih dalam Terma Penggunaan.
Penafian
Maklumat dan penerbitan adalah tidak bertujuan, dan tidak membentuk, nasihat atau cadangan kewangan, pelaburan, dagangan atau jenis lain yang diberikan atau disahkan oleh TradingView. Baca lebih dalam Terma Penggunaan.