OPEN-SOURCE SCRIPT
Seasonality: Grains & Livestock [invincible3]
Seasonality: Grains & Livestock [invincible3]
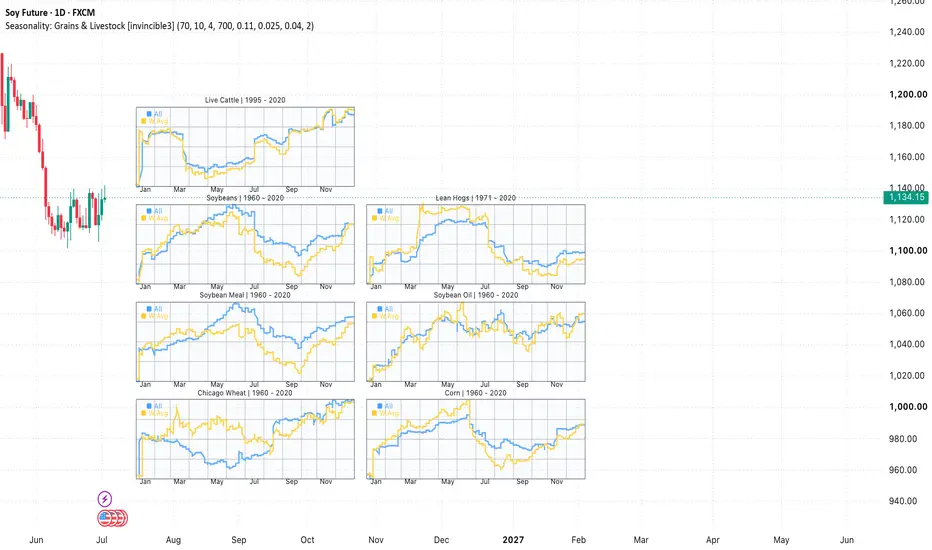
Seasonality: Grains & Livestock is a visual seasonality dashboard designed to help traders analyze historical yearly patterns across major grain and livestock futures markets.
The indicator displays compact 365-day seasonal mini charts directly on the price chart. Each market is shown in its own separate panel, allowing traders to quickly compare seasonal strength, weakness, turning points, and recurring calendar-based tendencies throughout the year.
Included markets:
• Chicago Wheat
• Corn
• Soybean Meal
• Soybean Oil
• Soybeans
• Lean Hogs
• Live Cattle
Each market includes two seasonal curves:
Blue Line — All Years Average
Shows the long-term historical seasonal tendency for the selected market.
Yellow Line — Weighted Average
Shows a weighted seasonal curve designed to place more emphasis on recent seasonal behavior while still preserving the broader historical pattern.
The dashboard includes flexible layout controls so users can adjust widget width, distance from candles, column spacing, panel height, row gap, and overall dashboard placement. Individual markets can be enabled or disabled, and users can choose whether to display the All Years curve, the Weighted Average curve, or both.
Key Features:
• Seasonality dashboard for grains and livestock
• Includes wheat, corn, soybeans, soybean meal, soybean oil, lean hogs, and live cattle
• 365-day calendar-based seasonal curves
• All Years average and Weighted Average comparison
• Separate mini chart for each market
• Monthly grid lines and month labels
• Adjustable widget size and spacing
• Right-side dashboard placement option
• Auto-theme color support
• Manual customization for line colors, grid, text, and background
• Clean visual panels for quick seasonal comparison
This indicator is useful for identifying historical periods where agricultural and livestock markets have commonly shown stronger or weaker seasonal tendencies. It can help traders add seasonal context to price action, market structure, trend analysis, supply-demand zones, and fundamental research.
The seasonality data is based on digitized 365-day historical seasonal curves and should be treated as a relative, shape-preserving seasonal guide rather than exact price data.
This indicator does not provide direct buy or sell signals. Seasonality should be used as a supporting research tool together with technical analysis, confirmation, and proper risk management.
Seasonality: Grains & Livestock is a visual seasonality dashboard designed to help traders analyze historical yearly patterns across major grain and livestock futures markets.
The indicator displays compact 365-day seasonal mini charts directly on the price chart. Each market is shown in its own separate panel, allowing traders to quickly compare seasonal strength, weakness, turning points, and recurring calendar-based tendencies throughout the year.
Included markets:
• Chicago Wheat
• Corn
• Soybean Meal
• Soybean Oil
• Soybeans
• Lean Hogs
• Live Cattle
Each market includes two seasonal curves:
Blue Line — All Years Average
Shows the long-term historical seasonal tendency for the selected market.
Yellow Line — Weighted Average
Shows a weighted seasonal curve designed to place more emphasis on recent seasonal behavior while still preserving the broader historical pattern.
The dashboard includes flexible layout controls so users can adjust widget width, distance from candles, column spacing, panel height, row gap, and overall dashboard placement. Individual markets can be enabled or disabled, and users can choose whether to display the All Years curve, the Weighted Average curve, or both.
Key Features:
• Seasonality dashboard for grains and livestock
• Includes wheat, corn, soybeans, soybean meal, soybean oil, lean hogs, and live cattle
• 365-day calendar-based seasonal curves
• All Years average and Weighted Average comparison
• Separate mini chart for each market
• Monthly grid lines and month labels
• Adjustable widget size and spacing
• Right-side dashboard placement option
• Auto-theme color support
• Manual customization for line colors, grid, text, and background
• Clean visual panels for quick seasonal comparison
This indicator is useful for identifying historical periods where agricultural and livestock markets have commonly shown stronger or weaker seasonal tendencies. It can help traders add seasonal context to price action, market structure, trend analysis, supply-demand zones, and fundamental research.
The seasonality data is based on digitized 365-day historical seasonal curves and should be treated as a relative, shape-preserving seasonal guide rather than exact price data.
This indicator does not provide direct buy or sell signals. Seasonality should be used as a supporting research tool together with technical analysis, confirmation, and proper risk management.
Skrip sumber terbuka
Dalam semangat TradingView sebenar, pencipta skrip ini telah menjadikannya sumber terbuka, jadi pedagang boleh menilai dan mengesahkan kefungsiannya. Terima kasih kepada penulis! Walaupuan anda boleh menggunakan secara percuma, ingat bahawa penerbitan semula kod ini tertakluk kepada Peraturan Dalaman.

Penafian
Maklumat dan penerbitan adalah tidak bertujuan, dan tidak membentuk, nasihat atau cadangan kewangan, pelaburan, dagangan atau jenis lain yang diberikan atau disahkan oleh TradingView. Baca lebih dalam Terma Penggunaan.
Skrip sumber terbuka
Dalam semangat TradingView sebenar, pencipta skrip ini telah menjadikannya sumber terbuka, jadi pedagang boleh menilai dan mengesahkan kefungsiannya. Terima kasih kepada penulis! Walaupuan anda boleh menggunakan secara percuma, ingat bahawa penerbitan semula kod ini tertakluk kepada Peraturan Dalaman.
Penafian
Maklumat dan penerbitan adalah tidak bertujuan, dan tidak membentuk, nasihat atau cadangan kewangan, pelaburan, dagangan atau jenis lain yang diberikan atau disahkan oleh TradingView. Baca lebih dalam Terma Penggunaan.