GC Trend Ensemble + Vol Sizing (long/flat)
OVERVIEW
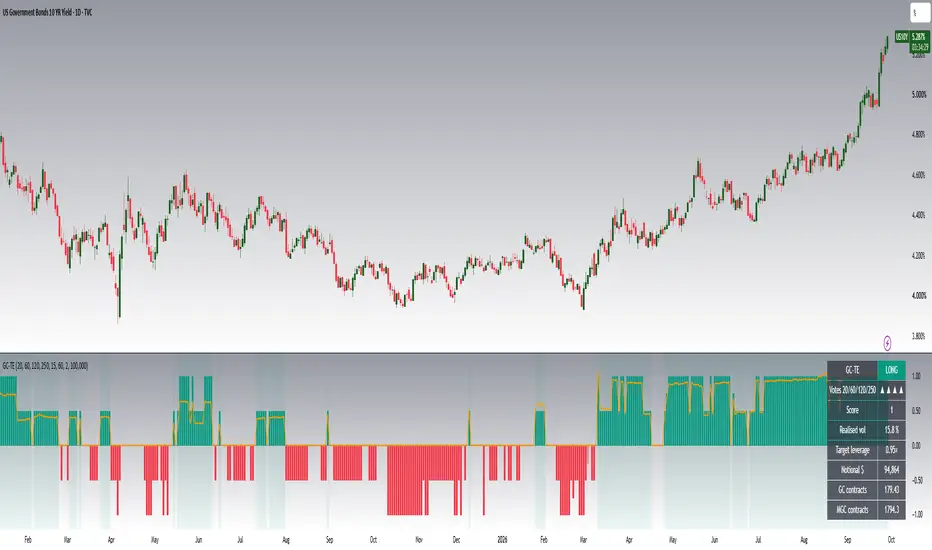
GC-TE is a slow, rules-based trend filter for COMEX gold futures (GC1! / MGC1!) on the daily chart. It answers two questions every day: should I hold gold, and how much? It is designed as a drawdown filter, not a high-return trading system.
WHY THIS DESIGN
Before building it, I tested common gold ideas on 16 years of CME GC data (June 2010 – September 2026, back-adjusted front month, transaction costs included):
- Intraday bar patterns (volume/candle exhaustion, RSI pullbacks with volume gates) on 15m and 1H showed no edge that survived across market regimes.
- Short-term trend rules (20-day) were mostly noise.
- Shorting gold on trend signals lost money in every variant, including the 2011–2015 bear market.
- The only approach that held up was a slow, multi-lookback trend vote, traded long or flat, with position size scaled to volatility.
This indicator implements exactly that rule, with standard (not optimised) settings.
HOW IT WORKS
1. Four trend votes: today's close vs. the close 20, 60, 120 and 250 trading days ago. Each vote is +1 (higher) or −1 (lower).
2. Trend score = average of the four votes (−1 to +1), shown as columns.
3. Long only when the score is positive; flat otherwise. The indicator never signals shorts.
4. Position size = score × (volatility target ÷ realised 60-day volatility), capped at a maximum leverage. When gold is calm the position is larger; when it is volatile, smaller.
5. The signal is read at the daily close and applies from the next session.
The table shows the current state (LONG/FLAT), each vote, realised volatility, target leverage, notional exposure and the equivalent number of GC and MGC contracts for the account size you enter.
HISTORICAL TEST (hypothetical, June 2011 – September 2026, default settings)
- Indicator rule: about 4.6% per year, worst drawdown about −18%
- Buy & hold GC futures: about 4.0% per year, worst drawdown about −46%
- 2011–2015 gold bear market: about +1.5% per year vs. about −8.1% per year for buy & hold
- 2022–2026 gold bull market: about +8.8% per year vs. about +12.8% per year for buy & hold
Results were similar across 30 nearby parameter variations, so they do not depend on one lucky setting.
LIMITATIONS — PLEASE READ
- The advantage is mainly smaller drawdowns, not higher returns. In strong bull markets it will lag buy & hold because it scales down and exits during pullbacks.
- 15 years is too short to prove the improvement statistically. Treat it as a risk-management tool, not a guaranteed edge.
- Trend rules have long flat or whipsaw periods (for example 2016–2018).
- Futures returns differ from spot XAUUSD because of roll costs. The test used futures.
- Past results do not guarantee future performance.
SETTINGS AND USAGE
- Use a DAILY chart of GC1! or MGC1!. The script stops with a message on other timeframes.
- Turn on back-adjustment for continuous futures (chart settings → "Adjust data for contract changes" / B-ADJ). Without it, contract roll gaps can distort the long-term votes.
- Inputs: the four lookbacks, volatility target (default 15% per year), volatility window (default 60 days), maximum leverage (default 2×) and account equity for the contract calculation.
- Alerts: "go LONG", "go FLAT" and "resize" (target MGC contract count changed). Set alerts to "Once Per Bar Close".
- Most retail accounts will find MGC (10 oz) more practical than GC (100 oz).
This script is for educational and research purposes and is not financial advice.
GC-TE is a slow, rules-based trend filter for COMEX gold futures (GC1! / MGC1!) on the daily chart. It answers two questions every day: should I hold gold, and how much? It is designed as a drawdown filter, not a high-return trading system.
WHY THIS DESIGN
Before building it, I tested common gold ideas on 16 years of CME GC data (June 2010 – September 2026, back-adjusted front month, transaction costs included):
- Intraday bar patterns (volume/candle exhaustion, RSI pullbacks with volume gates) on 15m and 1H showed no edge that survived across market regimes.
- Short-term trend rules (20-day) were mostly noise.
- Shorting gold on trend signals lost money in every variant, including the 2011–2015 bear market.
- The only approach that held up was a slow, multi-lookback trend vote, traded long or flat, with position size scaled to volatility.
This indicator implements exactly that rule, with standard (not optimised) settings.
HOW IT WORKS
1. Four trend votes: today's close vs. the close 20, 60, 120 and 250 trading days ago. Each vote is +1 (higher) or −1 (lower).
2. Trend score = average of the four votes (−1 to +1), shown as columns.
3. Long only when the score is positive; flat otherwise. The indicator never signals shorts.
4. Position size = score × (volatility target ÷ realised 60-day volatility), capped at a maximum leverage. When gold is calm the position is larger; when it is volatile, smaller.
5. The signal is read at the daily close and applies from the next session.
The table shows the current state (LONG/FLAT), each vote, realised volatility, target leverage, notional exposure and the equivalent number of GC and MGC contracts for the account size you enter.
HISTORICAL TEST (hypothetical, June 2011 – September 2026, default settings)
- Indicator rule: about 4.6% per year, worst drawdown about −18%
- Buy & hold GC futures: about 4.0% per year, worst drawdown about −46%
- 2011–2015 gold bear market: about +1.5% per year vs. about −8.1% per year for buy & hold
- 2022–2026 gold bull market: about +8.8% per year vs. about +12.8% per year for buy & hold
Results were similar across 30 nearby parameter variations, so they do not depend on one lucky setting.
LIMITATIONS — PLEASE READ
- The advantage is mainly smaller drawdowns, not higher returns. In strong bull markets it will lag buy & hold because it scales down and exits during pullbacks.
- 15 years is too short to prove the improvement statistically. Treat it as a risk-management tool, not a guaranteed edge.
- Trend rules have long flat or whipsaw periods (for example 2016–2018).
- Futures returns differ from spot XAUUSD because of roll costs. The test used futures.
- Past results do not guarantee future performance.
SETTINGS AND USAGE
- Use a DAILY chart of GC1! or MGC1!. The script stops with a message on other timeframes.
- Turn on back-adjustment for continuous futures (chart settings → "Adjust data for contract changes" / B-ADJ). Without it, contract roll gaps can distort the long-term votes.
- Inputs: the four lookbacks, volatility target (default 15% per year), volatility window (default 60 days), maximum leverage (default 2×) and account equity for the contract calculation.
- Alerts: "go LONG", "go FLAT" and "resize" (target MGC contract count changed). Set alerts to "Once Per Bar Close".
- Most retail accounts will find MGC (10 oz) more practical than GC (100 oz).
This script is for educational and research purposes and is not financial advice.

Sharing clean, logical market analysis focused on liquidity, structure and volume. No signals, no pressure — just education. If you want more insights, you’re welcome to join: t.me/+CE3Vdc5m72w4MjRk
Penafian
Maklumat dan penerbitan adalah tidak bertujuan, dan tidak membentuk, nasihat atau cadangan kewangan, pelaburan, dagangan atau jenis lain yang diberikan atau disahkan oleh TradingView. Baca lebih dalam Terma Penggunaan.
Sharing clean, logical market analysis focused on liquidity, structure and volume. No signals, no pressure — just education. If you want more insights, you’re welcome to join: t.me/+CE3Vdc5m72w4MjRk
Penafian
Maklumat dan penerbitan adalah tidak bertujuan, dan tidak membentuk, nasihat atau cadangan kewangan, pelaburan, dagangan atau jenis lain yang diberikan atau disahkan oleh TradingView. Baca lebih dalam Terma Penggunaan.