Statistical Valuation Oscillator [QuantAlgo]
🟢 Overview
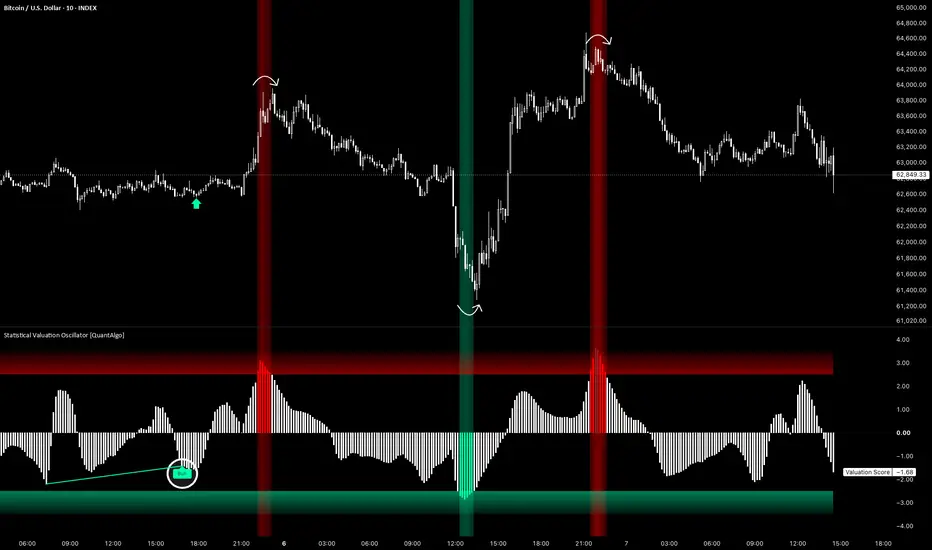
The Statistical Valuation Oscillator measures how far a market has stretched from its own rolling fair value, expressed in units of statistical dispersion rather than raw price. Unlike conventional oscillators bounded to a fixed 0 to 100 range or reacting to raw price change, this indicator establishes a live fair value reference and then scores displacement against it relative to how widely the market has been ranging, so every reading is scaled to the instrument's own recent behavior. A reading of plus three means the same degree of overextension on a low volatility index as it does on a high beta altcoin. The framework is extended by a source transform layer that controls how much trend drift carries into the score, and by adaptive zones that recalibrate the overvalued and undervalued thresholds to the conditions the market has actually produced.

🟢 How It Works
The oscillator applies a source transform before any scoring takes place, and this is the single largest control over how the score behaves. Three modes are available. One scores the series as it comes, which retains the most trend drift and will lean persistently positive through sustained uptrends. One compresses that drift, which suits instruments with a large percentage range such as crypto and high growth equities. One detrends against a long structural reference before scoring, producing the most stationary series and the most balanced distribution of overvalued and undervalued readings. The last two shift the scale of the score, so zone levels are worth reviewing after switching, or adaptive mode can handle the rescaling automatically.
The transformed series is then conditioned and scored against a live fair value reference, which becomes the zero line of the oscillator. Displacement from that reference is normalized against how widely the market has been ranging over the same period, so the output is a single self-scaling value whose meaning holds across symbols and timeframes rather than depending on the price level or volatility of the instrument.
Zone thresholds operate in one of two modes. Fixed holds the overvalued and undervalued edges at constant score values, so a band tag always represents the same statistical distance from fair value and means the same thing on every chart. Adaptive derives those same four edges from where the score has actually been trading across a long history window, so the bands widen through volatile stretches and tighten through quiet ones, recalibrating without manual retuning when scanning many instruments or after changing the source transform. An optional divergence engine compares confirmed price pivots against the valuation reading at those pivots, qualifying a pivot either by its position inside an extreme band or by how unusual that reading is against recent history.

🟢 How to Use It
▶ Overvalued Zone Tags: The score pushes into the upper band, indicating the market sits a statistically unusual distance above its own rolling fair value. The shading deepens as the score travels from the inner edge toward the outer edge, giving an immediate read on how stretched the condition has become. These readings favor a mean reversion interpretation, flagging conditions ripe for exhaustion rather than fresh continuation, and carry the most weight when they arrive late in an extended directional move.
▶ Undervalued Zone Tags: The score pushes into the lower band, indicating an unusually large negative displacement from fair value. The same intensity logic applies in reverse, with deeper shading marking a more dislocated reading. This is the environment to look for capitulation and downside exhaustion rather than fresh continuation lower.
▶ Fair Value Crosses: The dotted zero line marks rolling fair value. A cross above indicates the market has moved from below to above its own rolling reference, and a cross below indicates the reverse. These transitions are useful as a state marker for which side of fair value the market is currently trading, rather than as standalone entries. Trend traders can read the columns the same way, treating a histogram holding above zero as a bullish bias and one holding below as bearish, and using band tags as a signal that the move is stretched rather than as an immediate reversal call.

🟢 Features
▶ Market Presets: Five preconfigured parameter sets sized to the typical volatility of each asset class, covering Crypto, Stocks, Indices, Commodities, and Forex, alongside a Custom option for full manual control. Each preset applies tuned values for the conditioning window, the valuation window, and the four fixed zone levels. Selecting a preset overrides those numeric fields inside the calculation only, so the input boxes continue to display your own numbers while the chart uses the preset values. Start on a preset to get oriented, then switch to Custom once you know which levels suit your market and timeframe.

▶ Adaptive Zone Mode: Rather than reading fixed score thresholds, adaptive mode derives all four zone edges from where the score has actually been trading recently, so the bands expand through volatile conditions and contract through quiet ones. This removes the need to retune thresholds manually when scanning many symbols and timeframes, or after changing the source transform, since a shift in the score's scale is absorbed automatically.

▶ Divergence Detection: A configurable divergence engine with control over pivot sensitivity, the minimum and maximum bar separation between compared pivots, and a minimum separation requirement that sets how pronounced the disagreement must be before a divergence is drawn. An optional qualifier widens detection to include pivots that are statistically stretched without quite reaching a band. A bearish divergence pairs a higher price high with a lower valuation reading, meaning the new high is less statistically stretched than the previous one. A bullish divergence pairs a lower price low with a higher valuation reading. Both indicate the move is losing statistical conviction. Detection runs on closed bars only, so lines and labels never repaint once drawn.

▶ Built-in Alerts: A full alert set covering every state the oscillator produces. Zone alerts fire on entry to and exit from both the standard and deep overvalued and undervalued bands, with a combined option covering all zone events through a single setup. Fair value cross alerts fire in either direction or through a single combined condition. Divergence alerts fire on bullish, bearish, or any divergence, and a single any event alert covers the complete set. An optional confirmed bar setting restricts zone evaluation to closed bars so nothing fires from intrabar movement.

▶ Visual Customization: Six color presets (Classic, Aqua, Cosmic, Cyber, Neon, plus Custom) applied consistently across the histogram, the zone bands, the divergence lines and labels, and the background tint. The histogram column width is adjustable for readability across timeframes, and the histogram, zone bands, and fair value line can each be toggled independently for a minimal pane. Optional extreme zone highlighting tints the oscillator pane background whenever the score sits inside a band, with the tint deepening as the reading approaches the outer edge, and can be mirrored onto the main price chart to read valuation extremes without looking away from price.

The Statistical Valuation Oscillator measures how far a market has stretched from its own rolling fair value, expressed in units of statistical dispersion rather than raw price. Unlike conventional oscillators bounded to a fixed 0 to 100 range or reacting to raw price change, this indicator establishes a live fair value reference and then scores displacement against it relative to how widely the market has been ranging, so every reading is scaled to the instrument's own recent behavior. A reading of plus three means the same degree of overextension on a low volatility index as it does on a high beta altcoin. The framework is extended by a source transform layer that controls how much trend drift carries into the score, and by adaptive zones that recalibrate the overvalued and undervalued thresholds to the conditions the market has actually produced.
🟢 How It Works
The oscillator applies a source transform before any scoring takes place, and this is the single largest control over how the score behaves. Three modes are available. One scores the series as it comes, which retains the most trend drift and will lean persistently positive through sustained uptrends. One compresses that drift, which suits instruments with a large percentage range such as crypto and high growth equities. One detrends against a long structural reference before scoring, producing the most stationary series and the most balanced distribution of overvalued and undervalued readings. The last two shift the scale of the score, so zone levels are worth reviewing after switching, or adaptive mode can handle the rescaling automatically.
The transformed series is then conditioned and scored against a live fair value reference, which becomes the zero line of the oscillator. Displacement from that reference is normalized against how widely the market has been ranging over the same period, so the output is a single self-scaling value whose meaning holds across symbols and timeframes rather than depending on the price level or volatility of the instrument.
Zone thresholds operate in one of two modes. Fixed holds the overvalued and undervalued edges at constant score values, so a band tag always represents the same statistical distance from fair value and means the same thing on every chart. Adaptive derives those same four edges from where the score has actually been trading across a long history window, so the bands widen through volatile stretches and tighten through quiet ones, recalibrating without manual retuning when scanning many instruments or after changing the source transform. An optional divergence engine compares confirmed price pivots against the valuation reading at those pivots, qualifying a pivot either by its position inside an extreme band or by how unusual that reading is against recent history.
🟢 How to Use It
▶ Overvalued Zone Tags: The score pushes into the upper band, indicating the market sits a statistically unusual distance above its own rolling fair value. The shading deepens as the score travels from the inner edge toward the outer edge, giving an immediate read on how stretched the condition has become. These readings favor a mean reversion interpretation, flagging conditions ripe for exhaustion rather than fresh continuation, and carry the most weight when they arrive late in an extended directional move.
▶ Undervalued Zone Tags: The score pushes into the lower band, indicating an unusually large negative displacement from fair value. The same intensity logic applies in reverse, with deeper shading marking a more dislocated reading. This is the environment to look for capitulation and downside exhaustion rather than fresh continuation lower.
▶ Fair Value Crosses: The dotted zero line marks rolling fair value. A cross above indicates the market has moved from below to above its own rolling reference, and a cross below indicates the reverse. These transitions are useful as a state marker for which side of fair value the market is currently trading, rather than as standalone entries. Trend traders can read the columns the same way, treating a histogram holding above zero as a bullish bias and one holding below as bearish, and using band tags as a signal that the move is stretched rather than as an immediate reversal call.
🟢 Features
▶ Market Presets: Five preconfigured parameter sets sized to the typical volatility of each asset class, covering Crypto, Stocks, Indices, Commodities, and Forex, alongside a Custom option for full manual control. Each preset applies tuned values for the conditioning window, the valuation window, and the four fixed zone levels. Selecting a preset overrides those numeric fields inside the calculation only, so the input boxes continue to display your own numbers while the chart uses the preset values. Start on a preset to get oriented, then switch to Custom once you know which levels suit your market and timeframe.
▶ Adaptive Zone Mode: Rather than reading fixed score thresholds, adaptive mode derives all four zone edges from where the score has actually been trading recently, so the bands expand through volatile conditions and contract through quiet ones. This removes the need to retune thresholds manually when scanning many symbols and timeframes, or after changing the source transform, since a shift in the score's scale is absorbed automatically.
▶ Divergence Detection: A configurable divergence engine with control over pivot sensitivity, the minimum and maximum bar separation between compared pivots, and a minimum separation requirement that sets how pronounced the disagreement must be before a divergence is drawn. An optional qualifier widens detection to include pivots that are statistically stretched without quite reaching a band. A bearish divergence pairs a higher price high with a lower valuation reading, meaning the new high is less statistically stretched than the previous one. A bullish divergence pairs a lower price low with a higher valuation reading. Both indicate the move is losing statistical conviction. Detection runs on closed bars only, so lines and labels never repaint once drawn.
▶ Built-in Alerts: A full alert set covering every state the oscillator produces. Zone alerts fire on entry to and exit from both the standard and deep overvalued and undervalued bands, with a combined option covering all zone events through a single setup. Fair value cross alerts fire in either direction or through a single combined condition. Divergence alerts fire on bullish, bearish, or any divergence, and a single any event alert covers the complete set. An optional confirmed bar setting restricts zone evaluation to closed bars so nothing fires from intrabar movement.
▶ Visual Customization: Six color presets (Classic, Aqua, Cosmic, Cyber, Neon, plus Custom) applied consistently across the histogram, the zone bands, the divergence lines and labels, and the background tint. The histogram column width is adjustable for readability across timeframes, and the histogram, zone bands, and fair value line can each be toggled independently for a minimal pane. Optional extreme zone highlighting tints the oscillator pane background whenever the score sits inside a band, with the tint deepening as the reading approaches the outer edge, and can be mirrored onto the main price chart to read valuation extremes without looking away from price.
Tersedia dalam Ruangan Berbayar
Penunjuk ini hanya tersedia untuk pelanggan QuantAlgo Essential. Sertai untuk mengaksesnya dan skrip-skrip lain dari QuantAlgo.

🟢 Access our best trading & investing tools: joinquantalgo.com/plans
🟢 Free Special Edition indicators: joinquantalgo.com/special-editions
🟢 Discord: discord.gg/hJaFyGEAyX
🟢 Free Special Edition indicators: joinquantalgo.com/special-editions
🟢 Discord: discord.gg/hJaFyGEAyX
Penafian
Maklumat dan penerbitan adalah tidak bertujuan, dan tidak membentuk, nasihat atau cadangan kewangan, pelaburan, dagangan atau jenis lain yang diberikan atau disahkan oleh TradingView. Baca lebih dalam Terma Penggunaan.
Tersedia dalam Ruangan Berbayar
Penunjuk ini hanya tersedia untuk pelanggan QuantAlgo Essential. Sertai untuk mengaksesnya dan skrip-skrip lain dari QuantAlgo.
🟢 Access our best trading & investing tools: joinquantalgo.com/plans
🟢 Free Special Edition indicators: joinquantalgo.com/special-editions
🟢 Discord: discord.gg/hJaFyGEAyX
🟢 Free Special Edition indicators: joinquantalgo.com/special-editions
🟢 Discord: discord.gg/hJaFyGEAyX
Penafian
Maklumat dan penerbitan adalah tidak bertujuan, dan tidak membentuk, nasihat atau cadangan kewangan, pelaburan, dagangan atau jenis lain yang diberikan atau disahkan oleh TradingView. Baca lebih dalam Terma Penggunaan.