Telah dikemas kini
NASH Breaker Block v2 ENTRY SIGNALS
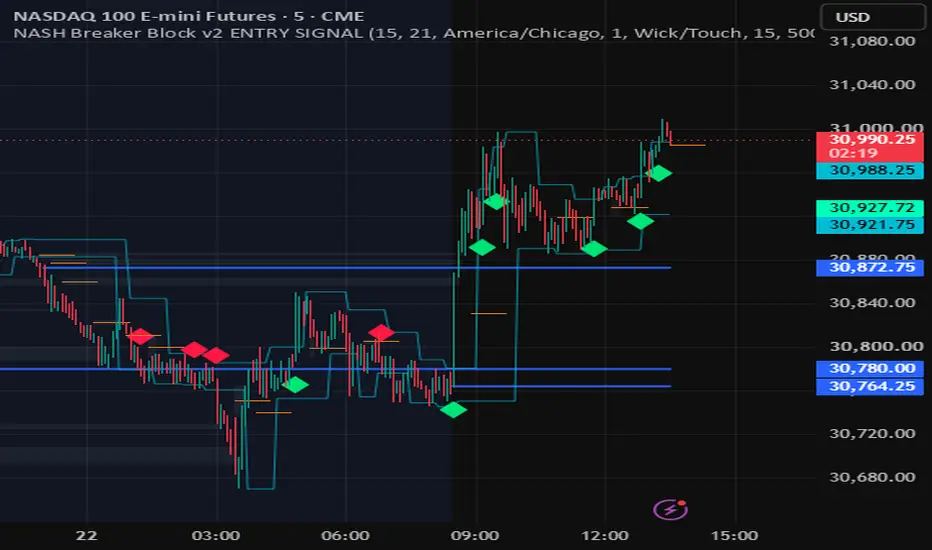
OFFICIAL Breaker Block v2 ENTRY SIGNALS
Three-Open Bias + BOS/FVG Entry Signal
Description (paste everything from "Overview" through "future results.")
Overview
This indicator is built for intraday trading of CME index futures such as NQ, MNQ, ES and MES, and is designed for 1- to 5-minute charts. It does three jobs on one chart. It plots the three session opens that anchor the futures trading day and scores their order into a daily bias at the New York open. It tracks the most recent confirmed swing high and swing low. And it prints an entry signal when price breaks one of those swings with a 15-minute fair value gap behind the break. The levels show where the day is anchored and which way it is leaning. The signal shows whether structure has broken with real displacement behind it.
Quick setup: add it to a 1- or 5-minute NQ or MNQ chart with standard candles, give each of the three open lines its own color in the Style tab, and turn on "Show label at 8:30am CT" if you want the daily read printed on the chart.
The three opens
Each level is the exact open price of the 1-minute candle at its anchor time. All times are Central Time (America/Chicago), and daylight saving time is handled automatically.
5:00 pm CT is the Globex open (6:00 pm New York time), where the new futures trading day begins.
11:00 pm CT is the New York midnight open, labeled MNO (12:00 am New York time).
8:30 am CT is the New York cash open (9:30 am New York time).
At 8:30 am CT the indicator compares the three prices in time order. Each step scores plus one when the later open is higher than the earlier one and minus one when it is not (an exact tie counts as minus one), so the total is plus two, zero or minus two.
Plus two reads Bulls Strong: the 5 pm open is below the 11 pm open, which is below the 8:30 open. Price opened higher at every anchor.
Minus two reads Bears Strong: the 5 pm open is above the 11 pm open, which is above the 8:30 open. Price opened lower at every anchor.
Zero reads Mixed / No Edge: the opens disagree and there is no clean hierarchy.
The read stands until the next 5:00 pm CT open, which resets all three levels and starts a new cycle. The reasoning is simple. When price keeps opening higher at each of the day's anchor times, buyers have held control from the Globex open through the overnight session into New York, and the reverse holds for sellers. The indicator does not forecast from this. It makes the relationship visible and measures it the same way every day.
The entry signal: break of structure (BOS) plus fair value gap (FVG)
The diamonds come from a separate engine that works in four steps.
Step 1. Structure. The indicator tracks the most recent confirmed swing high and swing low on your chart timeframe. A swing high is a bar whose high stands above the 3 bars on each side of it (Structure Pivot Length, default 3), so a swing is only confirmed 3 bars after it forms. These two prices are drawn as thin aqua lines and act as the edges of the current mini range.
Step 2. The break. A long break is a candle that closes above the tracked swing high. A short break is a candle that closes below the tracked swing low. That is the default Close mode; in Wick/Touch mode the candle's high or low only has to trade through the level.
Step 3. The fuel. A break becomes a signal only if a qualifying 15-minute fair value gap sits on the side the move came from. For a long, the indicator needs a bullish 15-minute gap, created within the last 60 chart bars, whose top is at or below the broken swing high and no more than 120 points below it. For a short, it needs a bearish 15-minute gap whose bottom is at or above the broken swing low and no more than 120 points above it. The gap is the evidence that price displaced into the break rather than drifting through it. By default a gap still counts after price has traded back into it; you can require untouched gaps only.
Step 4. One shot per level. A swing level is consumed the moment it is broken, whether or not the break produced a signal, so the same level can never fire twice.
A green diamond below a candle is a long signal. A red diamond above a candle is a short signal. The diamond prints on the candle that broke the level.
The diamond does not use the three-open score. With default settings the signal is structure plus imbalance only, and the opens are context for you to judge it against. Two optional filters connect them directly (see Settings).
How to read a signal against the levels
Start with the stack. After 8:30 am CT, note whether the day reads Bulls Strong, Bears Strong or Mixed. Green diamonds agree with a Bulls Strong day and red diamonds agree with a Bears Strong day. A Mixed day gives no directional edge from the opens, so each signal has to stand on its own.
Then check location. A long diamond printing above all three opens has every anchor of the day beneath it. A long diamond printing below one or more opens is breaking out underneath prices where the day already opened, and those levels sit overhead as potential reaction points. Shorts mirror this. The most aligned case is a break that clears the levels in the same direction as the stack.
Before 8:30 am CT only the 5 pm and 11 pm opens exist and no read has printed yet, so premarket signals can only be judged against those two levels.
Use the drawn references. The aqua line marks the exact swing level that was broken. The orange lines mark the midpoints of recent 15-minute gaps, which some traders use as a retracement reference instead of entering on the breaking candle. The nearest open on the opposite side of a signal is one reference for where the idea stops holding.
These are reading guidelines. The script does not enforce them, and none of them guarantees an outcome.
What you see with default settings
Three horizontal lines for the 5:00 pm, 11:00 pm and 8:30 am CT opens. Each appears at its anchor time and stays until the next 5:00 pm CT reset. At the reset, the 5 pm line moves to the new open, and the 11 pm and 8:30 lines end until their next anchor times. All three share the same default color, so give each its own color in the Style tab.
Two thin aqua lines at the tracked swing high and swing low. They move to a new price when a new swing is confirmed. A level that has already been broken stays drawn until the next swing replaces it, but it cannot trigger again.
Short orange lines, 10 bars long, at the midpoint (50 percent) of each new 15-minute fair value gap, starting on the bar where the gap is confirmed.
Faint gray boxes over 15-minute gaps that price has touched or traded back into, spanning from the bar the gap was confirmed to the first bar that touched it.
Green and red diamonds for long and short signals.
What is calculated but hidden by default
The boxes of untouched 15-minute gaps. They are tracked and extend to the right, but the Bullish and Bearish FVG colors are fully transparent. Lower the transparency of those two colors in the Inputs tab to see them.
The 15-minute 21 EMA line. It is calculated and used by the filters, but its Line Color is fully transparent. Lower that transparency in the Inputs tab to show it.
The EMA trend background. Its toggle is on, but its colors are fully transparent. Raise their opacity in the Style tab to shade the chart green while price is above the EMA and red while it is below.
The Open-Break triangles, a secondary signal described below. They stay hidden while "Isolate" is on, and their alerts still work.
The 8:30 am CT label, which prints the day's read with all three prices. Off by default.
The background tint after the New York open. Off by default, and it stays transparent even when turned on until you raise its opacity in the Style tab.
The signal labels that print the broken level's price. Off by default.
The Open-Break signal (secondary)
Turn off "Isolate" to see triangles wherever price breaks through any of the three opens. In the default Wick/Touch mode, a long break is a bar whose high trades above an open after the previous bar closed at or below it, and a short break mirrors that with the low. In Close mode the bar must close through the level after the previous bar closed on the other side. By default these breaks also require the close to be on the matching side of the 15-minute 21 EMA. Because price can tap the same open many times, this signal is much noisier than the diamonds. It is meant as a level-interaction alert, not an entry.
How the fair value gaps are defined
A bullish 15-minute gap exists when the low of a completed 15-minute candle is above the high of the 15-minute candle two bars before it. That leaves a price range between them that only the middle candle traded through. A bearish gap is the mirror image. A gap is marked mitigated the first time any chart bar touches or trades into its range.
Alerts
Long Entry and Short Entry fire with the diamonds.
Key LVL Bullish Breakout and Key LVL Bearish Breakout fire with the Open-Break signal, even while its triangles are hidden, and they follow the EMA filter setting.
5pm Open, Midnight Open and NY Open fire when each level forms.
FVG Appeared fires when a new 15-minute gap is detected.
Set the entry alerts to "Once Per Bar Close" so an alert only fires on a signal the closed bar confirms.
Settings
EMA Settings: anchor timeframe (15), period (21), line color, the trend background toggle, and whether Open-Break signals must be on the EMA side.
Open Levels: timezone, the lower timeframe used to read exact opens (keep 1 minute), level plotting, the 8:30 label, the background tint, Open-Break signals on or off, and Close or Wick/Touch detection for them.
FVG Settings: the gap timeframe (15), the bullish and bearish box colors, and the midline color.
BOS + FVG Signal: the engine on or off, Isolate, pivot length (3), Close or Wick/Touch break detection, swing line plotting, and signal labels. It also sets the maximum gap distance from the broken level in price units (120), the maximum gap age in chart bars (60), whether the gap must match the trade direction (on), and whether it must still be untouched (off). Two optional filters are off by default. "ALSO require EMA side" allows longs only above the 15-minute EMA and shorts only below it. "ALSO require an open-level break" requires the breaking candle to also break one of the three opens on the same bar, which makes signals much rarer.
What makes it original
Session opens, swing structure and fair value gaps are all public concepts. What this script contributes is how they are measured and combined.
The opens are read from 1-minute intrabars at exact clock times, so each level is the true open of that minute regardless of how the chart's bars are aligned.
The three opens are reduced to one ordered read of plus two, zero or minus two, instead of being left as three unrelated lines.
The entry requires two confirmations from two timeframes to agree on direction and location: a structure break on the chart timeframe, and a 15-minute imbalance positioned behind that break within a set distance and age. Rather than drawing gaps and breaks as separate markings, the script uses the gap as a condition on the break, and each swing level is single-use, so it produces at most one signal.
Each component answers a different question. The opens give time-based context, the structure break gives timing, the 15-minute gap gives evidence of displacement, and the EMA is an optional trend filter. They are combined so a signal can be judged against the day's context on one chart instead of across several separate tools.
Limitations and realtime behavior
The levels need a candle at exactly 5:00 pm, 11:00 pm and 8:30 am CT, so the script is built for futures that trade nearly around the clock. On symbols without data at those times, some levels will not form and no daily read is produced, but the diamonds still work. On holidays and shortened sessions a level can fail to refresh, and that day's read can use a stale value.
The anchors are fixed clock times in the selected timezone. Changing the Timezone input moves them, so keep America/Chicago for the intended Globex, midnight and New York opens.
Use chart timeframes from 1 to 15 minutes, with 1 to 5 minutes intended for the signal. The opens are read from 1-minute data, and the 15-minute gap and EMA requests are not designed for charts above 15 minutes. TradingView limits how much lower-timeframe data a script can load, so on higher chart timeframes the levels may be missing from the oldest part of the chart.
Nothing is plotted back in time. Swing lines start on the bar where a swing is confirmed, 3 bars after it formed, and gap boxes and midlines start on the bar where the gap is confirmed.
The distance input is in price units, not ticks. The default of 120 is sized for NQ; scale it down for instruments with smaller point ranges.
Only the most recent 500 boxes and 500 lines stay on the chart. Older drawings are removed automatically.
Realtime behavior: on historical bars, a 15-minute gap is recognized when its third 15-minute candle closes, and the 15-minute EMA uses closed values. In real time on lower chart timeframes, the gap check runs on the first chart bar of that third 15-minute candle, using only the prices available at that point, and the EMA follows the forming 15-minute candle. Live, a gap can therefore appear up to one 15-minute candle earlier than it does on history, and it can still be filled before that candle closes. A diamond that printed live on the strength of such a gap may not appear after a chart refresh. In Close mode a diamond can also appear and disappear while its own candle is forming, and it is final only when that candle closes. Treat live signals with this in mind.
Use standard candlestick or bar charts. Signals on Heikin Ashi, Renko and other synthetic chart types are not valid.
Three-Open Bias + BOS/FVG Entry Signal
Description (paste everything from "Overview" through "future results.")
Overview
This indicator is built for intraday trading of CME index futures such as NQ, MNQ, ES and MES, and is designed for 1- to 5-minute charts. It does three jobs on one chart. It plots the three session opens that anchor the futures trading day and scores their order into a daily bias at the New York open. It tracks the most recent confirmed swing high and swing low. And it prints an entry signal when price breaks one of those swings with a 15-minute fair value gap behind the break. The levels show where the day is anchored and which way it is leaning. The signal shows whether structure has broken with real displacement behind it.
Quick setup: add it to a 1- or 5-minute NQ or MNQ chart with standard candles, give each of the three open lines its own color in the Style tab, and turn on "Show label at 8:30am CT" if you want the daily read printed on the chart.
The three opens
Each level is the exact open price of the 1-minute candle at its anchor time. All times are Central Time (America/Chicago), and daylight saving time is handled automatically.
5:00 pm CT is the Globex open (6:00 pm New York time), where the new futures trading day begins.
11:00 pm CT is the New York midnight open, labeled MNO (12:00 am New York time).
8:30 am CT is the New York cash open (9:30 am New York time).
At 8:30 am CT the indicator compares the three prices in time order. Each step scores plus one when the later open is higher than the earlier one and minus one when it is not (an exact tie counts as minus one), so the total is plus two, zero or minus two.
Plus two reads Bulls Strong: the 5 pm open is below the 11 pm open, which is below the 8:30 open. Price opened higher at every anchor.
Minus two reads Bears Strong: the 5 pm open is above the 11 pm open, which is above the 8:30 open. Price opened lower at every anchor.
Zero reads Mixed / No Edge: the opens disagree and there is no clean hierarchy.
The read stands until the next 5:00 pm CT open, which resets all three levels and starts a new cycle. The reasoning is simple. When price keeps opening higher at each of the day's anchor times, buyers have held control from the Globex open through the overnight session into New York, and the reverse holds for sellers. The indicator does not forecast from this. It makes the relationship visible and measures it the same way every day.
The entry signal: break of structure (BOS) plus fair value gap (FVG)
The diamonds come from a separate engine that works in four steps.
Step 1. Structure. The indicator tracks the most recent confirmed swing high and swing low on your chart timeframe. A swing high is a bar whose high stands above the 3 bars on each side of it (Structure Pivot Length, default 3), so a swing is only confirmed 3 bars after it forms. These two prices are drawn as thin aqua lines and act as the edges of the current mini range.
Step 2. The break. A long break is a candle that closes above the tracked swing high. A short break is a candle that closes below the tracked swing low. That is the default Close mode; in Wick/Touch mode the candle's high or low only has to trade through the level.
Step 3. The fuel. A break becomes a signal only if a qualifying 15-minute fair value gap sits on the side the move came from. For a long, the indicator needs a bullish 15-minute gap, created within the last 60 chart bars, whose top is at or below the broken swing high and no more than 120 points below it. For a short, it needs a bearish 15-minute gap whose bottom is at or above the broken swing low and no more than 120 points above it. The gap is the evidence that price displaced into the break rather than drifting through it. By default a gap still counts after price has traded back into it; you can require untouched gaps only.
Step 4. One shot per level. A swing level is consumed the moment it is broken, whether or not the break produced a signal, so the same level can never fire twice.
A green diamond below a candle is a long signal. A red diamond above a candle is a short signal. The diamond prints on the candle that broke the level.
The diamond does not use the three-open score. With default settings the signal is structure plus imbalance only, and the opens are context for you to judge it against. Two optional filters connect them directly (see Settings).
How to read a signal against the levels
Start with the stack. After 8:30 am CT, note whether the day reads Bulls Strong, Bears Strong or Mixed. Green diamonds agree with a Bulls Strong day and red diamonds agree with a Bears Strong day. A Mixed day gives no directional edge from the opens, so each signal has to stand on its own.
Then check location. A long diamond printing above all three opens has every anchor of the day beneath it. A long diamond printing below one or more opens is breaking out underneath prices where the day already opened, and those levels sit overhead as potential reaction points. Shorts mirror this. The most aligned case is a break that clears the levels in the same direction as the stack.
Before 8:30 am CT only the 5 pm and 11 pm opens exist and no read has printed yet, so premarket signals can only be judged against those two levels.
Use the drawn references. The aqua line marks the exact swing level that was broken. The orange lines mark the midpoints of recent 15-minute gaps, which some traders use as a retracement reference instead of entering on the breaking candle. The nearest open on the opposite side of a signal is one reference for where the idea stops holding.
These are reading guidelines. The script does not enforce them, and none of them guarantees an outcome.
What you see with default settings
Three horizontal lines for the 5:00 pm, 11:00 pm and 8:30 am CT opens. Each appears at its anchor time and stays until the next 5:00 pm CT reset. At the reset, the 5 pm line moves to the new open, and the 11 pm and 8:30 lines end until their next anchor times. All three share the same default color, so give each its own color in the Style tab.
Two thin aqua lines at the tracked swing high and swing low. They move to a new price when a new swing is confirmed. A level that has already been broken stays drawn until the next swing replaces it, but it cannot trigger again.
Short orange lines, 10 bars long, at the midpoint (50 percent) of each new 15-minute fair value gap, starting on the bar where the gap is confirmed.
Faint gray boxes over 15-minute gaps that price has touched or traded back into, spanning from the bar the gap was confirmed to the first bar that touched it.
Green and red diamonds for long and short signals.
What is calculated but hidden by default
The boxes of untouched 15-minute gaps. They are tracked and extend to the right, but the Bullish and Bearish FVG colors are fully transparent. Lower the transparency of those two colors in the Inputs tab to see them.
The 15-minute 21 EMA line. It is calculated and used by the filters, but its Line Color is fully transparent. Lower that transparency in the Inputs tab to show it.
The EMA trend background. Its toggle is on, but its colors are fully transparent. Raise their opacity in the Style tab to shade the chart green while price is above the EMA and red while it is below.
The Open-Break triangles, a secondary signal described below. They stay hidden while "Isolate" is on, and their alerts still work.
The 8:30 am CT label, which prints the day's read with all three prices. Off by default.
The background tint after the New York open. Off by default, and it stays transparent even when turned on until you raise its opacity in the Style tab.
The signal labels that print the broken level's price. Off by default.
The Open-Break signal (secondary)
Turn off "Isolate" to see triangles wherever price breaks through any of the three opens. In the default Wick/Touch mode, a long break is a bar whose high trades above an open after the previous bar closed at or below it, and a short break mirrors that with the low. In Close mode the bar must close through the level after the previous bar closed on the other side. By default these breaks also require the close to be on the matching side of the 15-minute 21 EMA. Because price can tap the same open many times, this signal is much noisier than the diamonds. It is meant as a level-interaction alert, not an entry.
How the fair value gaps are defined
A bullish 15-minute gap exists when the low of a completed 15-minute candle is above the high of the 15-minute candle two bars before it. That leaves a price range between them that only the middle candle traded through. A bearish gap is the mirror image. A gap is marked mitigated the first time any chart bar touches or trades into its range.
Alerts
Long Entry and Short Entry fire with the diamonds.
Key LVL Bullish Breakout and Key LVL Bearish Breakout fire with the Open-Break signal, even while its triangles are hidden, and they follow the EMA filter setting.
5pm Open, Midnight Open and NY Open fire when each level forms.
FVG Appeared fires when a new 15-minute gap is detected.
Set the entry alerts to "Once Per Bar Close" so an alert only fires on a signal the closed bar confirms.
Settings
EMA Settings: anchor timeframe (15), period (21), line color, the trend background toggle, and whether Open-Break signals must be on the EMA side.
Open Levels: timezone, the lower timeframe used to read exact opens (keep 1 minute), level plotting, the 8:30 label, the background tint, Open-Break signals on or off, and Close or Wick/Touch detection for them.
FVG Settings: the gap timeframe (15), the bullish and bearish box colors, and the midline color.
BOS + FVG Signal: the engine on or off, Isolate, pivot length (3), Close or Wick/Touch break detection, swing line plotting, and signal labels. It also sets the maximum gap distance from the broken level in price units (120), the maximum gap age in chart bars (60), whether the gap must match the trade direction (on), and whether it must still be untouched (off). Two optional filters are off by default. "ALSO require EMA side" allows longs only above the 15-minute EMA and shorts only below it. "ALSO require an open-level break" requires the breaking candle to also break one of the three opens on the same bar, which makes signals much rarer.
What makes it original
Session opens, swing structure and fair value gaps are all public concepts. What this script contributes is how they are measured and combined.
The opens are read from 1-minute intrabars at exact clock times, so each level is the true open of that minute regardless of how the chart's bars are aligned.
The three opens are reduced to one ordered read of plus two, zero or minus two, instead of being left as three unrelated lines.
The entry requires two confirmations from two timeframes to agree on direction and location: a structure break on the chart timeframe, and a 15-minute imbalance positioned behind that break within a set distance and age. Rather than drawing gaps and breaks as separate markings, the script uses the gap as a condition on the break, and each swing level is single-use, so it produces at most one signal.
Each component answers a different question. The opens give time-based context, the structure break gives timing, the 15-minute gap gives evidence of displacement, and the EMA is an optional trend filter. They are combined so a signal can be judged against the day's context on one chart instead of across several separate tools.
Limitations and realtime behavior
The levels need a candle at exactly 5:00 pm, 11:00 pm and 8:30 am CT, so the script is built for futures that trade nearly around the clock. On symbols without data at those times, some levels will not form and no daily read is produced, but the diamonds still work. On holidays and shortened sessions a level can fail to refresh, and that day's read can use a stale value.
The anchors are fixed clock times in the selected timezone. Changing the Timezone input moves them, so keep America/Chicago for the intended Globex, midnight and New York opens.
Use chart timeframes from 1 to 15 minutes, with 1 to 5 minutes intended for the signal. The opens are read from 1-minute data, and the 15-minute gap and EMA requests are not designed for charts above 15 minutes. TradingView limits how much lower-timeframe data a script can load, so on higher chart timeframes the levels may be missing from the oldest part of the chart.
Nothing is plotted back in time. Swing lines start on the bar where a swing is confirmed, 3 bars after it formed, and gap boxes and midlines start on the bar where the gap is confirmed.
The distance input is in price units, not ticks. The default of 120 is sized for NQ; scale it down for instruments with smaller point ranges.
Only the most recent 500 boxes and 500 lines stay on the chart. Older drawings are removed automatically.
Realtime behavior: on historical bars, a 15-minute gap is recognized when its third 15-minute candle closes, and the 15-minute EMA uses closed values. In real time on lower chart timeframes, the gap check runs on the first chart bar of that third 15-minute candle, using only the prices available at that point, and the EMA follows the forming 15-minute candle. Live, a gap can therefore appear up to one 15-minute candle earlier than it does on history, and it can still be filled before that candle closes. A diamond that printed live on the strength of such a gap may not appear after a chart refresh. In Close mode a diamond can also appear and disappear while its own candle is forming, and it is final only when that candle closes. Treat live signals with this in mind.
Use standard candlestick or bar charts. Signals on Heikin Ashi, Renko and other synthetic chart types are not valid.
Nota Keluaran
.
Penafian
Maklumat dan penerbitan adalah tidak bertujuan, dan tidak membentuk, nasihat atau cadangan kewangan, pelaburan, dagangan atau jenis lain yang diberikan atau disahkan oleh TradingView. Baca lebih dalam Terma Penggunaan.
Penafian
Maklumat dan penerbitan adalah tidak bertujuan, dan tidak membentuk, nasihat atau cadangan kewangan, pelaburan, dagangan atau jenis lain yang diberikan atau disahkan oleh TradingView. Baca lebih dalam Terma Penggunaan.