SMT + iFVG Confluence Tool | Dominion Tools
Levels + Gaps
What it does
Marks two things on the chart and shows you where they overlap.
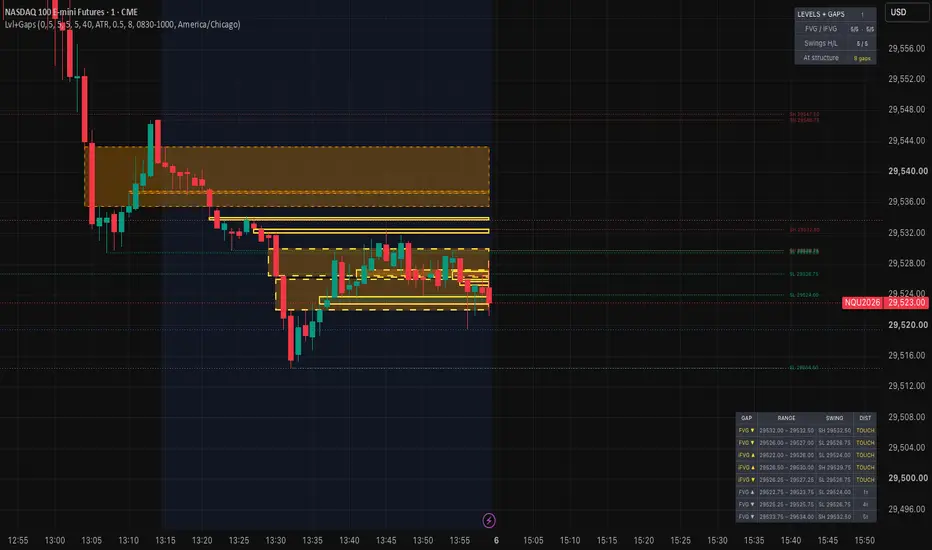
Fair value gaps. A three-candle imbalance where the first and third candles don't overlap. Bullish gaps are drawn from the first candle's high to the third candle's low; bearish gaps are the inverse. The most recent five are kept as active zones, extending right until price interacts with them.
Inverted gaps (iFVG). When a bar closes fully through a gap, the zone doesn't disappear — it flips. A bullish gap closed through to the downside becomes potential resistance; a bearish gap closed through to the upside becomes potential support. Inverted zones move into a separate pool of the last five, so a fresh burst of new gaps won't push an important inverted level off the chart.
Swing levels. The last five confirmed pivot highs and five pivot lows on your current timeframe, drawn as extending rays with price labels.
Gap-at-structure highlighting. Every zone is measured against every swing level. Any gap sitting within your proximity threshold gets a bright border, and a table lists them sorted nearest first — zone type and direction, its price range, which swing it's near, and the distance in ticks. TOUCH means the level runs through the zone.
Why the two are combined
Gap tools and structure tools are common separately. Reading them together usually means eyeballing whether a zone happens to sit on a level. This does that measurement for you and ranks the results, so overlap is something you can see rather than estimate. The separate active/inverted pools exist for the same reason: on lower timeframes gaps form fast, and a single combined list will bury an inverted zone under new ones within minutes.
How to use it
Add to any chart and any timeframe. Everything scales to the instrument automatically.
Set the swing pivot length for the structure you care about — lower values catch more swings, higher values give cleaner levels. Set the proximity threshold in ATR multiples if you switch timeframes often, or in ticks for a fixed measurement on one instrument. Around 0.5 ATR is generous and most nearby zones will highlight; drop toward 0.2 for genuine overlaps only.
Raise the minimum gap size if a fast chart gets cluttered. Adjust how many zones and levels to keep if five isn't right for your workflow.
Optional session shading is included for anyone who wants a visual reminder of a specific window. It's off by default and filters nothing.
Alerts
Four available: gap inverted upward, gap inverted downward, swing high confirmed, swing low confirmed.
Settings
Gap detection: minimum size in ticks, active count, inverted count, colors
Swing levels: pivot length, count kept per side, price labels, ray length, colors
Proximity: ATR multiple or fixed ticks, highlight color, table on/off
Display: status panel, session shading with timezone, confirmed-bars mode
Repainting
Confirmed-bars mode is on by default: zones and levels commit only when a bar closes. Turn it off and you'll see them form earlier, with the tradeoff that an unconfirmed zone can vanish before the bar completes. No higher-timeframe data requests, so there's no request.security lookahead concern.
Pivots confirm after the fact by design. With a length of 5, a swing level appears five bars after the actual high or low. That delay is inherent to pivot detection, not a flaw — but it means levels draw later than the price reaction that created them.
Notes
This is a visualization tool. It draws zones and levels and measures the distance between them. It doesn't produce entries, exits, targets, or directional bias, and the highlighting indicates proximity only, not quality or probability. Nothing here should be read as a trade recommendation. Test any approach thoroughly before risking capital.
What it does
Marks two things on the chart and shows you where they overlap.
Fair value gaps. A three-candle imbalance where the first and third candles don't overlap. Bullish gaps are drawn from the first candle's high to the third candle's low; bearish gaps are the inverse. The most recent five are kept as active zones, extending right until price interacts with them.
Inverted gaps (iFVG). When a bar closes fully through a gap, the zone doesn't disappear — it flips. A bullish gap closed through to the downside becomes potential resistance; a bearish gap closed through to the upside becomes potential support. Inverted zones move into a separate pool of the last five, so a fresh burst of new gaps won't push an important inverted level off the chart.
Swing levels. The last five confirmed pivot highs and five pivot lows on your current timeframe, drawn as extending rays with price labels.
Gap-at-structure highlighting. Every zone is measured against every swing level. Any gap sitting within your proximity threshold gets a bright border, and a table lists them sorted nearest first — zone type and direction, its price range, which swing it's near, and the distance in ticks. TOUCH means the level runs through the zone.
Why the two are combined
Gap tools and structure tools are common separately. Reading them together usually means eyeballing whether a zone happens to sit on a level. This does that measurement for you and ranks the results, so overlap is something you can see rather than estimate. The separate active/inverted pools exist for the same reason: on lower timeframes gaps form fast, and a single combined list will bury an inverted zone under new ones within minutes.
How to use it
Add to any chart and any timeframe. Everything scales to the instrument automatically.
Set the swing pivot length for the structure you care about — lower values catch more swings, higher values give cleaner levels. Set the proximity threshold in ATR multiples if you switch timeframes often, or in ticks for a fixed measurement on one instrument. Around 0.5 ATR is generous and most nearby zones will highlight; drop toward 0.2 for genuine overlaps only.
Raise the minimum gap size if a fast chart gets cluttered. Adjust how many zones and levels to keep if five isn't right for your workflow.
Optional session shading is included for anyone who wants a visual reminder of a specific window. It's off by default and filters nothing.
Alerts
Four available: gap inverted upward, gap inverted downward, swing high confirmed, swing low confirmed.
Settings
Gap detection: minimum size in ticks, active count, inverted count, colors
Swing levels: pivot length, count kept per side, price labels, ray length, colors
Proximity: ATR multiple or fixed ticks, highlight color, table on/off
Display: status panel, session shading with timezone, confirmed-bars mode
Repainting
Confirmed-bars mode is on by default: zones and levels commit only when a bar closes. Turn it off and you'll see them form earlier, with the tradeoff that an unconfirmed zone can vanish before the bar completes. No higher-timeframe data requests, so there's no request.security lookahead concern.
Pivots confirm after the fact by design. With a length of 5, a swing level appears five bars after the actual high or low. That delay is inherent to pivot detection, not a flaw — but it means levels draw later than the price reaction that created them.
Notes
This is a visualization tool. It draws zones and levels and measures the distance between them. It doesn't produce entries, exits, targets, or directional bias, and the highlighting indicates proximity only, not quality or probability. Nothing here should be read as a trade recommendation. Test any approach thoroughly before risking capital.

Penafian
Maklumat dan penerbitan adalah tidak bertujuan, dan tidak membentuk, nasihat atau cadangan kewangan, pelaburan, dagangan atau jenis lain yang diberikan atau disahkan oleh TradingView. Baca lebih dalam Terma Penggunaan.
Penafian
Maklumat dan penerbitan adalah tidak bertujuan, dan tidak membentuk, nasihat atau cadangan kewangan, pelaburan, dagangan atau jenis lain yang diberikan atau disahkan oleh TradingView. Baca lebih dalam Terma Penggunaan.