Telah dikemas kini
Multi timeframe Liquidity levels
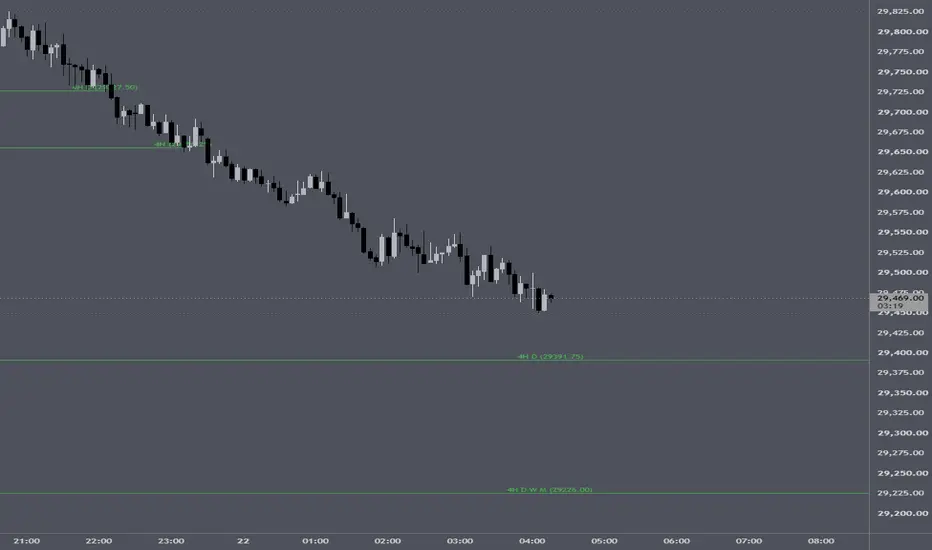
Multi timeframe Liquidity levels — Identify Swing Liquidity Across Timeframes
Overview
Swing Liquidity Lines MTF is a multi-timeframe indicator designed to identify swing highs and swing lows, visualize their liquidity levels, and track when those levels are swept by price.
Swing highs and lows are natural reference points for traders. They often attract attention because they represent previous price extremes where stop-loss orders and breakout orders may be concentrated.
This indicator automatically draws horizontal lines from confirmed swing highs and swing lows, extends them until price sweeps the level, and marks the sweep with an X. It also identifies levels that coincide with important timeframe extremes, labeling them **4H, D, W, or M**.
The objective is simple: make potential liquidity levels easier to identify, monitor, and study without manually drawing and updating lines.
Key Features
1. Automatic Swing High and Swing Low Detection
The indicator uses confirmed pivot highs and pivot lows to identify potential liquidity levels.
- Swing highs: Displayed as red horizontal lines.
- Swing lows: Displayed as green horizontal lines.
- Configurable pivot sensitivity: Choose the number of bars required on either side of a pivot.
The default setting is five bars on each side. This helps filter out some minor fluctuations while identifying meaningful local price extremes.
A swing is confirmed only after the required number of bars has formed to its right. Once confirmed, the line is drawn from the original swing candle.
2. Multi-Timeframe Analysis
The indicator allows you to select the timeframe used for swing detection independently of your chart timeframe.
For example, you can:
- Display 15-minute swing liquidity on a 5-minute chart.
- Monitor hourly swing liquidity while trading on a 5-minute chart.
- Use higher-timeframe swings to identify broader price reference levels.
The lines are anchored using timestamps, allowing them to align with the original swing candles rather than relying on chart-bar offsets.
For the intended workflow, select a source timeframe equal to or higher than your chart timeframe.
3. Automatic Liquidity Sweep Detection
Each swing level remains extended to the right until price breaches it.
A liquidity sweep is detected when price trades beyond the level:
- High-side liquidity: The candle's high moves above a swing high.
- Low-side liquidity: The candle's low moves below a swing low.
When a level is swept:
- The horizontal line stops at the sweep candle.
- An X marks the swept liquidity price.
- The level is removed from active tracking, preventing repeated sweep markings for that same line.
The sweep is based on a wick breach; a candle does not need to close beyond the level.
This distinction is important because a wick can sweep a previous extreme even when price subsequently closes back inside the prior range.
4. Higher-Timeframe Liquidity Labels
The indicator can label swing levels that coincide with important timeframe extremes:
- 4H — Four-hour candle high or low.
- D — Daily high or low.
- W — Weekly high or low.
- M — Monthly high or low.
A level can qualify for more than one label. For example, a swing low may coincide with both a daily low and a weekly low.
These labels help distinguish ordinary swing liquidity from levels associated with broader timeframe extremes.
The labels follow active liquidity levels toward the latest bar, so their timeframe classifications remain visible without requiring you to scroll back to the original swing. When the level is swept, its label stays at the sweep bar.
5. Customization
The indicator includes settings for:
- Source timeframe
- Pivot left/right bar count
- Maximum number of active levels
- Visibility of swing highs and swing lows
- Visibility of timeframe labels
- Visibility of sweep markers
- High and low line colors
- Sweep marker colors
- Line width and style
These settings allow you to adapt the display to your chart, trading style, and preferred level of detail.
How to Use the Indicator
Step 1: Choose Your Source Timeframe
Select the timeframe whose swing structure you want to monitor.
For example, if you trade NQ futures on a 5-minute chart, you might start with a 60-minute source timeframe to identify broader swing liquidity.
You can then experiment with shorter or longer source timeframes to see how the density and relevance of the levels change.
Step 2: Adjust Pivot Sensitivity
The default pivot setting is five bars on each side.
A smaller value identifies more frequent swings, including minor price fluctuations. A larger value generally produces fewer, more pronounced swing levels.
There is no universally optimal setting. The appropriate value depends on the timeframe, instrument, and type of price structure you want to study.
Step 3: Observe Unswept Liquidity
Pay attention to the red and green lines that have not yet been swept.
These levels identify previous price extremes that remain intact according to the indicator's wick-breach rule.
Use them as reference points when analyzing:
- Potential liquidity targets
- Nearby swing resistance and support
- Range boundaries
- Price reactions around previous extremes
- The relationship between lower-timeframe movement and higher-timeframe structure
An unswept level is a reference point, not a prediction that price must reach it.
Step 4: Observe How Price Interacts With a Level
When price breaches a level, the line stops and an X marks the sweep.
Study what happens next. Price may reverse, consolidate, continue in the same direction, or sweep additional levels.
The indicator does not assume that every sweep produces a reversal. The subsequent price behavior must be evaluated in context.
Step 5: Use Timeframe Labels to Establish Context
A swing level labeled 4H, D, W, or M can help you distinguish timeframe extremes from ordinary swing points.
For example, you may want to study whether price reacts differently around daily or weekly extremes than around smaller intraday swings.
Use the labels as a way to organize your analysis, not as an automatic ranking of which levels are most likely to produce a reaction.
Suggested Workflow for Intraday Traders
For intraday trading, a practical starting point is:
1. Open your preferred execution chart.
2. Select a higher source timeframe to identify broader swing liquidity.
3. Identify nearby unswept highs and lows.
4. Note any 4H, daily, weekly, or monthly classifications.
5. Observe how price approaches, breaches, and reacts to those levels.
6. Combine the information with your existing market-structure analysis, confirmation rules, and risk management.
The indicator can also be used for historical study. Review previously swept levels and measure how often different types of levels are followed by reversals, continuation, consolidation, or further liquidity sweeps.
This can help you develop instrument-specific statistics instead of relying on assumptions about liquidity behavior.
Important Considerations
Swing confirmation introduces a delay. A pivot is not confirmed until the configured number of bars has formed to its right. The line is anchored to the original pivot, but the level becomes identifiable only after confirmation.
A sweep does not guarantee a reversal. Price can continue beyond a swept high or low. The indicator identifies the event; it does not predict its outcome.
Timeframe classifications can change. Daily, weekly, monthly, and four-hour extremes can evolve while their respective periods are developing. A label should not automatically be interpreted as a finalized period high or low.
Source and chart timeframes matter. The intended multi-timeframe workflow uses a source timeframe equal to or higher than the chart timeframe. Lower source timeframes may not be represented reliably when requested from a higher-timeframe chart.
This is an analytical tool, not a trading system. It does not generate buy or sell signals, recommend position sizes, or guarantee profitable outcomes. Use appropriate risk management and independently validate any strategy built around its levels.
Final Thoughts
Swing Liquidity Lines MTF is designed to simplify the identification and monitoring of swing liquidity across multiple timeframes.
By automatically plotting swing highs and lows, tracking wick breaches, marking sweeps, and highlighting important timeframe extremes, it provides a structured way to observe how price interacts with previous market levels.
Use it to map the market, build hypotheses, and collect statistics. The real value comes from understanding how price behaves around these levels in the context of your own trading framework.
Disclaimer
For educational and analytical purposes only. This indicator does not constitute financial advice or guarantee trading results.
Overview
Swing Liquidity Lines MTF is a multi-timeframe indicator designed to identify swing highs and swing lows, visualize their liquidity levels, and track when those levels are swept by price.
Swing highs and lows are natural reference points for traders. They often attract attention because they represent previous price extremes where stop-loss orders and breakout orders may be concentrated.
This indicator automatically draws horizontal lines from confirmed swing highs and swing lows, extends them until price sweeps the level, and marks the sweep with an X. It also identifies levels that coincide with important timeframe extremes, labeling them **4H, D, W, or M**.
The objective is simple: make potential liquidity levels easier to identify, monitor, and study without manually drawing and updating lines.
Key Features
1. Automatic Swing High and Swing Low Detection
The indicator uses confirmed pivot highs and pivot lows to identify potential liquidity levels.
- Swing highs: Displayed as red horizontal lines.
- Swing lows: Displayed as green horizontal lines.
- Configurable pivot sensitivity: Choose the number of bars required on either side of a pivot.
The default setting is five bars on each side. This helps filter out some minor fluctuations while identifying meaningful local price extremes.
A swing is confirmed only after the required number of bars has formed to its right. Once confirmed, the line is drawn from the original swing candle.
2. Multi-Timeframe Analysis
The indicator allows you to select the timeframe used for swing detection independently of your chart timeframe.
For example, you can:
- Display 15-minute swing liquidity on a 5-minute chart.
- Monitor hourly swing liquidity while trading on a 5-minute chart.
- Use higher-timeframe swings to identify broader price reference levels.
The lines are anchored using timestamps, allowing them to align with the original swing candles rather than relying on chart-bar offsets.
For the intended workflow, select a source timeframe equal to or higher than your chart timeframe.
3. Automatic Liquidity Sweep Detection
Each swing level remains extended to the right until price breaches it.
A liquidity sweep is detected when price trades beyond the level:
- High-side liquidity: The candle's high moves above a swing high.
- Low-side liquidity: The candle's low moves below a swing low.
When a level is swept:
- The horizontal line stops at the sweep candle.
- An X marks the swept liquidity price.
- The level is removed from active tracking, preventing repeated sweep markings for that same line.
The sweep is based on a wick breach; a candle does not need to close beyond the level.
This distinction is important because a wick can sweep a previous extreme even when price subsequently closes back inside the prior range.
4. Higher-Timeframe Liquidity Labels
The indicator can label swing levels that coincide with important timeframe extremes:
- 4H — Four-hour candle high or low.
- D — Daily high or low.
- W — Weekly high or low.
- M — Monthly high or low.
A level can qualify for more than one label. For example, a swing low may coincide with both a daily low and a weekly low.
These labels help distinguish ordinary swing liquidity from levels associated with broader timeframe extremes.
The labels follow active liquidity levels toward the latest bar, so their timeframe classifications remain visible without requiring you to scroll back to the original swing. When the level is swept, its label stays at the sweep bar.
5. Customization
The indicator includes settings for:
- Source timeframe
- Pivot left/right bar count
- Maximum number of active levels
- Visibility of swing highs and swing lows
- Visibility of timeframe labels
- Visibility of sweep markers
- High and low line colors
- Sweep marker colors
- Line width and style
These settings allow you to adapt the display to your chart, trading style, and preferred level of detail.
How to Use the Indicator
Step 1: Choose Your Source Timeframe
Select the timeframe whose swing structure you want to monitor.
For example, if you trade NQ futures on a 5-minute chart, you might start with a 60-minute source timeframe to identify broader swing liquidity.
You can then experiment with shorter or longer source timeframes to see how the density and relevance of the levels change.
Step 2: Adjust Pivot Sensitivity
The default pivot setting is five bars on each side.
A smaller value identifies more frequent swings, including minor price fluctuations. A larger value generally produces fewer, more pronounced swing levels.
There is no universally optimal setting. The appropriate value depends on the timeframe, instrument, and type of price structure you want to study.
Step 3: Observe Unswept Liquidity
Pay attention to the red and green lines that have not yet been swept.
These levels identify previous price extremes that remain intact according to the indicator's wick-breach rule.
Use them as reference points when analyzing:
- Potential liquidity targets
- Nearby swing resistance and support
- Range boundaries
- Price reactions around previous extremes
- The relationship between lower-timeframe movement and higher-timeframe structure
An unswept level is a reference point, not a prediction that price must reach it.
Step 4: Observe How Price Interacts With a Level
When price breaches a level, the line stops and an X marks the sweep.
Study what happens next. Price may reverse, consolidate, continue in the same direction, or sweep additional levels.
The indicator does not assume that every sweep produces a reversal. The subsequent price behavior must be evaluated in context.
Step 5: Use Timeframe Labels to Establish Context
A swing level labeled 4H, D, W, or M can help you distinguish timeframe extremes from ordinary swing points.
For example, you may want to study whether price reacts differently around daily or weekly extremes than around smaller intraday swings.
Use the labels as a way to organize your analysis, not as an automatic ranking of which levels are most likely to produce a reaction.
Suggested Workflow for Intraday Traders
For intraday trading, a practical starting point is:
1. Open your preferred execution chart.
2. Select a higher source timeframe to identify broader swing liquidity.
3. Identify nearby unswept highs and lows.
4. Note any 4H, daily, weekly, or monthly classifications.
5. Observe how price approaches, breaches, and reacts to those levels.
6. Combine the information with your existing market-structure analysis, confirmation rules, and risk management.
The indicator can also be used for historical study. Review previously swept levels and measure how often different types of levels are followed by reversals, continuation, consolidation, or further liquidity sweeps.
This can help you develop instrument-specific statistics instead of relying on assumptions about liquidity behavior.
Important Considerations
Swing confirmation introduces a delay. A pivot is not confirmed until the configured number of bars has formed to its right. The line is anchored to the original pivot, but the level becomes identifiable only after confirmation.
A sweep does not guarantee a reversal. Price can continue beyond a swept high or low. The indicator identifies the event; it does not predict its outcome.
Timeframe classifications can change. Daily, weekly, monthly, and four-hour extremes can evolve while their respective periods are developing. A label should not automatically be interpreted as a finalized period high or low.
Source and chart timeframes matter. The intended multi-timeframe workflow uses a source timeframe equal to or higher than the chart timeframe. Lower source timeframes may not be represented reliably when requested from a higher-timeframe chart.
This is an analytical tool, not a trading system. It does not generate buy or sell signals, recommend position sizes, or guarantee profitable outcomes. Use appropriate risk management and independently validate any strategy built around its levels.
Final Thoughts
Swing Liquidity Lines MTF is designed to simplify the identification and monitoring of swing liquidity across multiple timeframes.
By automatically plotting swing highs and lows, tracking wick breaches, marking sweeps, and highlighting important timeframe extremes, it provides a structured way to observe how price interacts with previous market levels.
Use it to map the market, build hypotheses, and collect statistics. The real value comes from understanding how price behaves around these levels in the context of your own trading framework.
Disclaimer
For educational and analytical purposes only. This indicator does not constitute financial advice or guarantee trading results.
Nota Keluaran
Added an input option to add price level as well in the Liquidity label. For example the labels can now be shown as 4H D(7704).Nota Keluaran
Updated label with price and added tagsNota Keluaran
Changed default time to 30 mins.
— TraderMaggu
Price • Time • Statistics
Sharing original market research, time-based range statistics, and data-driven trading insights.
Follow on X: x.com/traderM2024
Price • Time • Statistics
Sharing original market research, time-based range statistics, and data-driven trading insights.
Follow on X: x.com/traderM2024
Penafian
Maklumat dan penerbitan adalah tidak bertujuan, dan tidak membentuk, nasihat atau cadangan kewangan, pelaburan, dagangan atau jenis lain yang diberikan atau disahkan oleh TradingView. Baca lebih dalam Terma Penggunaan.
— TraderMaggu
Price • Time • Statistics
Sharing original market research, time-based range statistics, and data-driven trading insights.
Follow on X: x.com/traderM2024
Price • Time • Statistics
Sharing original market research, time-based range statistics, and data-driven trading insights.
Follow on X: x.com/traderM2024
Penafian
Maklumat dan penerbitan adalah tidak bertujuan, dan tidak membentuk, nasihat atau cadangan kewangan, pelaburan, dagangan atau jenis lain yang diberikan atau disahkan oleh TradingView. Baca lebih dalam Terma Penggunaan.