OPEN-SOURCE SCRIPT
Telah dikemas kini IC KEY LEVELS & ICE
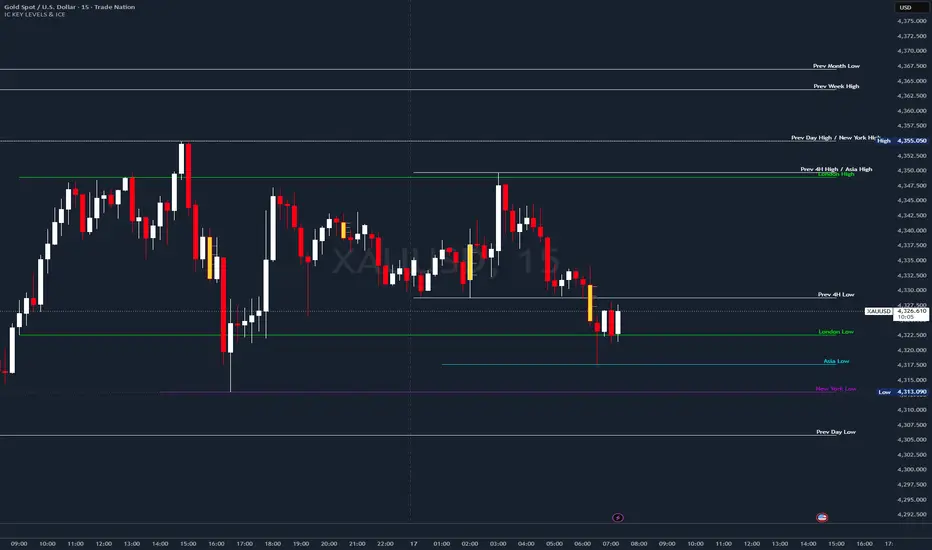
This is the IC Key Levels indicator — a multi-timeframe price level plotting tool built around the concept that key opens, highs, lows, and midpoints from higher timeframes act as significant support/resistance levels on lower timeframe charts.
What it plots
It draws horizontal lines with labels for the following levels, each toggleable independently:
4H — Previous 4H open, high, low, and midpoint
Daily — Current day's open, previous day's high, low, and midpoint
Monday Range — Monday's high, low, and midpoint (resets each week)
Weekly — Current week's open, previous week's high, low, and midpoint
Monthly — Current month's open, previous month's high, low, and midpoint
Quarterly — Current quarter's open, previous quarter's high, low, and midpoint
Yearly — Current year's open, current year's high, low, and midpoint
FX Sessions — London, New York, and Asia session highs, lows, and opens (tracked in each city's local timezone)
Key features
Merge Levels — When two or more levels share the exact same price, their labels are combined into one (e.g. "WO / MO"), preventing label clutter at confluences.
Display Style — Lines can be drawn from where the period opened ("Standard") or anchored to a fixed distance from the right edge of the chart ("Right Anchored"), useful for keeping levels visible regardless of how far you've scrolled.
Global Coloring — A single master color can override all individual timeframe colors at once.
Shorthand Labels — Each group can be switched to abbreviated text (e.g. "PWH" instead of "Prev Week High") to reduce chart noise.
Line customisation — Width (Small/Medium/Large), style (Solid/Dashed/Dotted), and label size are all configurable globally.
The philosophy behind it
This is rooted in ICT (Inner Circle Trader) concepts — hence "IC" in the name. The idea is that institutional order flow tends to react at these periodic open/high/low prices because large participants reference the same levels. The Monday Range in particular is a key ICT concept, as Monday's price action is often considered a "draw" that the rest of the week either sweeps or respects. Session ranges (London, NY, Asia) are similarly used to identify where liquidity was taken and where price may return.
ICE CANDLE LOGIC INCLUDED
What it plots
It draws horizontal lines with labels for the following levels, each toggleable independently:
4H — Previous 4H open, high, low, and midpoint
Daily — Current day's open, previous day's high, low, and midpoint
Monday Range — Monday's high, low, and midpoint (resets each week)
Weekly — Current week's open, previous week's high, low, and midpoint
Monthly — Current month's open, previous month's high, low, and midpoint
Quarterly — Current quarter's open, previous quarter's high, low, and midpoint
Yearly — Current year's open, current year's high, low, and midpoint
FX Sessions — London, New York, and Asia session highs, lows, and opens (tracked in each city's local timezone)
Key features
Merge Levels — When two or more levels share the exact same price, their labels are combined into one (e.g. "WO / MO"), preventing label clutter at confluences.
Display Style — Lines can be drawn from where the period opened ("Standard") or anchored to a fixed distance from the right edge of the chart ("Right Anchored"), useful for keeping levels visible regardless of how far you've scrolled.
Global Coloring — A single master color can override all individual timeframe colors at once.
Shorthand Labels — Each group can be switched to abbreviated text (e.g. "PWH" instead of "Prev Week High") to reduce chart noise.
Line customisation — Width (Small/Medium/Large), style (Solid/Dashed/Dotted), and label size are all configurable globally.
The philosophy behind it
This is rooted in ICT (Inner Circle Trader) concepts — hence "IC" in the name. The idea is that institutional order flow tends to react at these periodic open/high/low prices because large participants reference the same levels. The Monday Range in particular is a key ICT concept, as Monday's price action is often considered a "draw" that the rest of the week either sweeps or respects. Session ranges (London, NY, Asia) are similarly used to identify where liquidity was taken and where price may return.
ICE CANDLE LOGIC INCLUDED
Nota Keluaran
Added When a 15m candle closes above a session or 4H high, or below a session or 4H low, that level is automatically removed from the chart. There is a toggle in both the FX Sessions and 4H settings groups to turn this on or off. It is off by default. Skrip sumber terbuka
Dalam semangat TradingView sebenar, pencipta skrip ini telah menjadikannya sumber terbuka, jadi pedagang boleh menilai dan mengesahkan kefungsiannya. Terima kasih kepada penulis! Walaupuan anda boleh menggunakan secara percuma, ingat bahawa penerbitan semula kod ini tertakluk kepada Peraturan Dalaman.

Penafian
Maklumat dan penerbitan adalah tidak bertujuan, dan tidak membentuk, nasihat atau cadangan kewangan, pelaburan, dagangan atau jenis lain yang diberikan atau disahkan oleh TradingView. Baca lebih dalam Terma Penggunaan.
Skrip sumber terbuka
Dalam semangat TradingView sebenar, pencipta skrip ini telah menjadikannya sumber terbuka, jadi pedagang boleh menilai dan mengesahkan kefungsiannya. Terima kasih kepada penulis! Walaupuan anda boleh menggunakan secara percuma, ingat bahawa penerbitan semula kod ini tertakluk kepada Peraturan Dalaman.
Penafian
Maklumat dan penerbitan adalah tidak bertujuan, dan tidak membentuk, nasihat atau cadangan kewangan, pelaburan, dagangan atau jenis lain yang diberikan atau disahkan oleh TradingView. Baca lebih dalam Terma Penggunaan.