OPEN-SOURCE SCRIPT
Wyckoff v1.3: Effort vs Result
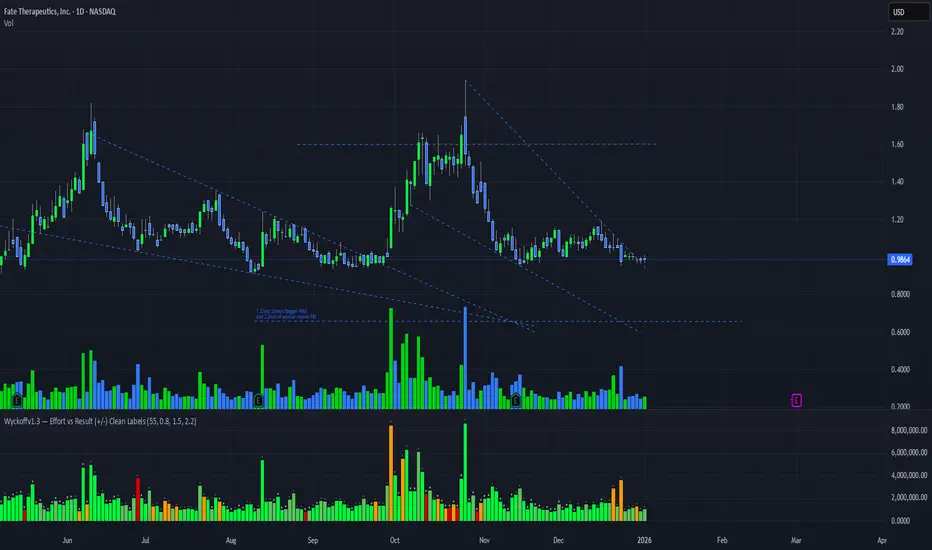
This script helps a trader know the actions of smart money - clearly differentiating between valid and in-valid price moves. It is a not script that'll give you buy/sell signals, but in a very Wyckoff way give you the essentials of tape reading of the current chart.
Code Algo: From current candle to previous N candles (N is variable), it calculates a parameter called R = (high-low)/volume; for each candle, hence forming a distribution of R's. Hence, parameter R takes into account the price-volume relationship together, combined which is paramount for Wyckoff reading. Then it calculates mean (M) and standard deviation (sigma) of all those R's. Hence, M denotes the regular price movements expected from a given volume, which will also be a 'valid' move. Then we calculate ranges M-x*sigma and M+x*sigma (where x is a constant) for 3 values of x: 0.5, 1.5 and 2.2. These ranges give us deviations from M, split into 3 different levels. 1st range (E1) is closer to M, 2nd range (E2) is slightly more deviated from M, 3rd range (E3) includes large deviations and 4th range (E4) gives us largest deviations (highest Wyckoff invalidation). Henceforth, we can assess the current candles R value and check which range does it fall into. This gives us the validation degree of this current candle's move in perspective of how the market behaved previously. We assign symbol '+' for this current candle if R>M (hence showing exhaustion) or '-' if R<M (hence showing absorption). This can be done for all bars in the chart.
Volume bars are then re-plotted in this indicator with color coded according these E1, E2, E3 and E4 ranges. Also, on the top of each bar, + or - signs are displayed.
How to read:
Current color coding is (can be changed):
E1 = Bright green (full validation)
E2 = Light mild green (Slight in-validation = considered still relatively valid)
E3 = Orange (higher in-validation)
E4 = Red (extreme in-validation)
On the top of bars, + or - signs denote exhaustion (small volume large price change) or absorption (high volume small price change).
Hence, each bar now can be visualized for the degree of Wyckoff validation (green = valid, red to most invalid) and how that degree of validation compares to the stock being absorbed or volume exhausted.
Please feel free to leave a comment!
Code Algo: From current candle to previous N candles (N is variable), it calculates a parameter called R = (high-low)/volume; for each candle, hence forming a distribution of R's. Hence, parameter R takes into account the price-volume relationship together, combined which is paramount for Wyckoff reading. Then it calculates mean (M) and standard deviation (sigma) of all those R's. Hence, M denotes the regular price movements expected from a given volume, which will also be a 'valid' move. Then we calculate ranges M-x*sigma and M+x*sigma (where x is a constant) for 3 values of x: 0.5, 1.5 and 2.2. These ranges give us deviations from M, split into 3 different levels. 1st range (E1) is closer to M, 2nd range (E2) is slightly more deviated from M, 3rd range (E3) includes large deviations and 4th range (E4) gives us largest deviations (highest Wyckoff invalidation). Henceforth, we can assess the current candles R value and check which range does it fall into. This gives us the validation degree of this current candle's move in perspective of how the market behaved previously. We assign symbol '+' for this current candle if R>M (hence showing exhaustion) or '-' if R<M (hence showing absorption). This can be done for all bars in the chart.
Volume bars are then re-plotted in this indicator with color coded according these E1, E2, E3 and E4 ranges. Also, on the top of each bar, + or - signs are displayed.
How to read:
Current color coding is (can be changed):
E1 = Bright green (full validation)
E2 = Light mild green (Slight in-validation = considered still relatively valid)
E3 = Orange (higher in-validation)
E4 = Red (extreme in-validation)
On the top of bars, + or - signs denote exhaustion (small volume large price change) or absorption (high volume small price change).
Hence, each bar now can be visualized for the degree of Wyckoff validation (green = valid, red to most invalid) and how that degree of validation compares to the stock being absorbed or volume exhausted.
Please feel free to leave a comment!
Skrip sumber terbuka
Dalam semangat TradingView sebenar, pencipta skrip ini telah menjadikannya sumber terbuka, jadi pedagang boleh menilai dan mengesahkan kefungsiannya. Terima kasih kepada penulis! Walaupuan anda boleh menggunakan secara percuma, ingat bahawa penerbitan semula kod ini tertakluk kepada Peraturan Dalaman.

Penafian
Maklumat dan penerbitan adalah tidak bertujuan, dan tidak membentuk, nasihat atau cadangan kewangan, pelaburan, dagangan atau jenis lain yang diberikan atau disahkan oleh TradingView. Baca lebih dalam Terma Penggunaan.
Skrip sumber terbuka
Dalam semangat TradingView sebenar, pencipta skrip ini telah menjadikannya sumber terbuka, jadi pedagang boleh menilai dan mengesahkan kefungsiannya. Terima kasih kepada penulis! Walaupuan anda boleh menggunakan secara percuma, ingat bahawa penerbitan semula kod ini tertakluk kepada Peraturan Dalaman.
Penafian
Maklumat dan penerbitan adalah tidak bertujuan, dan tidak membentuk, nasihat atau cadangan kewangan, pelaburan, dagangan atau jenis lain yang diberikan atau disahkan oleh TradingView. Baca lebih dalam Terma Penggunaan.