Taught to Trade - Regime Tercile Dashboard
🔵 OVERVIEW
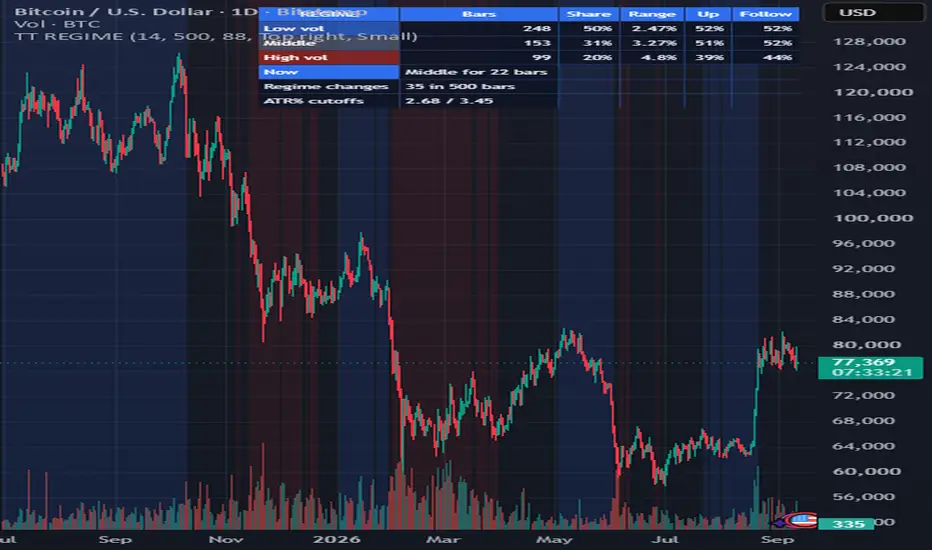
Most strategies are tested across one stretch of history and judged on a single number. This splits that history into its low, middle and high volatility thirds and reports how the instrument actually behaved inside each one.
The question it answers is not "what happens next". It is "does the thing I found exist in all three regimes, or only in one". An edge that lives in a single regime is a bet on the regime continuing, which is a different and much shorter bet than the one most people think they are making.
Everything is computed from closed bars. Nothing repaints.
🔵 WHAT A VOLATILITY REGIME IS HERE
ATR is expressed as a percentage of price, so instruments at different price levels are comparable. The sample window is then cut at its own 33rd and 67th percentiles. Bars below the lower cutoff are the low third, above the upper cutoff the high third, and the rest the middle.
The cutoffs are relative to the instrument and the window, not to any fixed number. A quiet week in one market can be a violent one in another, and a fixed ATR threshold would hide that.
🔵 HOW TO READ THE TABLE
Bars and Share show how the window divides. If one third holds most of the sample, the window is not really covering three regimes and the comparison is weak.
Range is the average high-to-low of a bar in that regime, as a percentage of price. It should rise from low to high. If it does not, the classification is not separating anything.
Up is the share of bars in that regime that closed above their open. This is the column worth sitting with. Volatility is a measure of range, not of direction, so there is no reason for this number to be far from 50 percent in any regime, and when it is, that is a property of the sample rather than a rule about the future.
Follow is conditional persistence: of the bars that followed an up bar in that regime, how many also closed up. Read it against the Up column, not on its own.
Now, Regime changes and ATR% cutoffs describe stability. Few changes across a long window means the regimes are broad and slow. Many means the classification is flickering and the per-regime statistics are thinner than the bar counts suggest.
🔵 HOW TO USE IT
Bucket your own past trades by the regime of their entry bar. The background shading makes that quick to do by eye. If every winning trade sits in one shaded band, you have found a regime, not a strategy.
Set the sample window to match the window your strategy was tested on, not to a round number. Comparing regimes across a window your test never touched tells you nothing about your test.
Check whether Range actually separates. If low and high thirds have nearly the same average bar range, the instrument has no meaningful volatility structure in that window, and the rest of the table is noise.
🔵 SETTINGS
ATR length and sample window size. Background shading on or off, with adjustable transparency. Table position and text size. Three alert conditions cover entering the high third, entering the low third, and any regime change. None of them fire on their own; you arm them yourself in the alerts dialog. This script does not send buy or sell signals and never will.
🔵 WHERE IT FAILS
The terciles are computed inside the same window they are judging. That is close to circular: a window that happens to be uniformly quiet will still be cut into three parts and labelled low, middle and high, and the labels will mean much less than they appear to.
A third is not a regime. Real regime changes are driven by things ATR cannot see, and the boundary between the 33rd and 34th percentile is arbitrary. A bar one tick either side of a cutoff gets a different label and is not meaningfully different.
The Up and Follow columns are descriptive statistics on a few hundred bars. Differences of a few percentage points are well inside what chance produces at that sample size, and nothing here corrects for that. Treat only large, stable gaps as worth a second look, and even then as a question rather than an answer.
ATR is backward looking. The current classification uses recent bars, so a regime change is visible only after it has been under way for a while. This will not warn you about anything.
Regime persistence is not modelled at all. Knowing that 20 percent of bars were high volatility says nothing about how long the current state lasts.
It measures bars, not your trades. Attributing your results to a regime by eye is a rough operation, and a proper version needs your actual trade list.
Open source, so you can read every calculation instead of taking any of this on trust.
Educational tool only, not investment advice. It does not predict anything and does not generate signals. Trading involves substantial risk of loss.
Most strategies are tested across one stretch of history and judged on a single number. This splits that history into its low, middle and high volatility thirds and reports how the instrument actually behaved inside each one.
The question it answers is not "what happens next". It is "does the thing I found exist in all three regimes, or only in one". An edge that lives in a single regime is a bet on the regime continuing, which is a different and much shorter bet than the one most people think they are making.
Everything is computed from closed bars. Nothing repaints.
🔵 WHAT A VOLATILITY REGIME IS HERE
ATR is expressed as a percentage of price, so instruments at different price levels are comparable. The sample window is then cut at its own 33rd and 67th percentiles. Bars below the lower cutoff are the low third, above the upper cutoff the high third, and the rest the middle.
The cutoffs are relative to the instrument and the window, not to any fixed number. A quiet week in one market can be a violent one in another, and a fixed ATR threshold would hide that.
🔵 HOW TO READ THE TABLE
Bars and Share show how the window divides. If one third holds most of the sample, the window is not really covering three regimes and the comparison is weak.
Range is the average high-to-low of a bar in that regime, as a percentage of price. It should rise from low to high. If it does not, the classification is not separating anything.
Up is the share of bars in that regime that closed above their open. This is the column worth sitting with. Volatility is a measure of range, not of direction, so there is no reason for this number to be far from 50 percent in any regime, and when it is, that is a property of the sample rather than a rule about the future.
Follow is conditional persistence: of the bars that followed an up bar in that regime, how many also closed up. Read it against the Up column, not on its own.
Now, Regime changes and ATR% cutoffs describe stability. Few changes across a long window means the regimes are broad and slow. Many means the classification is flickering and the per-regime statistics are thinner than the bar counts suggest.
🔵 HOW TO USE IT
Bucket your own past trades by the regime of their entry bar. The background shading makes that quick to do by eye. If every winning trade sits in one shaded band, you have found a regime, not a strategy.
Set the sample window to match the window your strategy was tested on, not to a round number. Comparing regimes across a window your test never touched tells you nothing about your test.
Check whether Range actually separates. If low and high thirds have nearly the same average bar range, the instrument has no meaningful volatility structure in that window, and the rest of the table is noise.
🔵 SETTINGS
ATR length and sample window size. Background shading on or off, with adjustable transparency. Table position and text size. Three alert conditions cover entering the high third, entering the low third, and any regime change. None of them fire on their own; you arm them yourself in the alerts dialog. This script does not send buy or sell signals and never will.
🔵 WHERE IT FAILS
The terciles are computed inside the same window they are judging. That is close to circular: a window that happens to be uniformly quiet will still be cut into three parts and labelled low, middle and high, and the labels will mean much less than they appear to.
A third is not a regime. Real regime changes are driven by things ATR cannot see, and the boundary between the 33rd and 34th percentile is arbitrary. A bar one tick either side of a cutoff gets a different label and is not meaningfully different.
The Up and Follow columns are descriptive statistics on a few hundred bars. Differences of a few percentage points are well inside what chance produces at that sample size, and nothing here corrects for that. Treat only large, stable gaps as worth a second look, and even then as a question rather than an answer.
ATR is backward looking. The current classification uses recent bars, so a regime change is visible only after it has been under way for a while. This will not warn you about anything.
Regime persistence is not modelled at all. Knowing that 20 percent of bars were high volatility says nothing about how long the current state lasts.
It measures bars, not your trades. Attributing your results to a regime by eye is a rough operation, and a proper version needs your actual trade list.
Open source, so you can read every calculation instead of taking any of this on trust.
Educational tool only, not investment advice. It does not predict anything and does not generate signals. Trading involves substantial risk of loss.

Free Pine Script teardowns, a repaint checker and honest tools: taughttotrade.com (educational only, not financial advice)
Penafian
Maklumat dan penerbitan adalah tidak bertujuan, dan tidak membentuk, nasihat atau cadangan kewangan, pelaburan, dagangan atau jenis lain yang diberikan atau disahkan oleh TradingView. Baca lebih dalam Terma Penggunaan.
Free Pine Script teardowns, a repaint checker and honest tools: taughttotrade.com (educational only, not financial advice)
Penafian
Maklumat dan penerbitan adalah tidak bertujuan, dan tidak membentuk, nasihat atau cadangan kewangan, pelaburan, dagangan atau jenis lain yang diberikan atau disahkan oleh TradingView. Baca lebih dalam Terma Penggunaan.