Telah dikemas kini
KC OHLC Scan
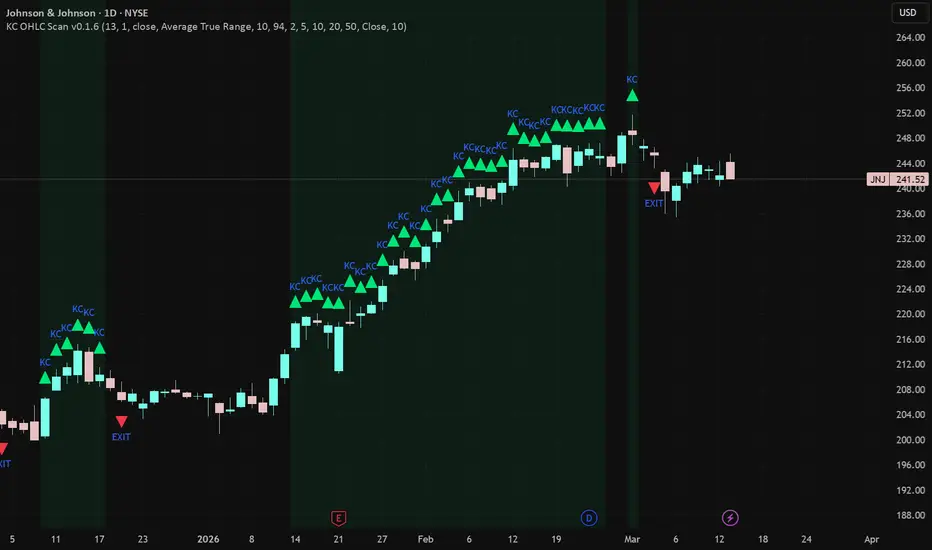
KC OHLC Scan v0.1.5 is a momentum and trend-persistence screener built for traders who want to find stocks showing real strength, not just mild upward drift.
At its core, this script looks for symbols where recent candles are trading above the upper Keltner Channel — a sign that price is pushing beyond its normal volatility envelope and that buyers may be in strong control. When this behavior persists across multiple candles, it can reveal stocks with exceptional momentum and leadership. ⚡
Why this script is powerful
Most trend tools only ask whether price is above a moving average. This script goes further.
You can independently choose whether the Open, High, Low, and/or Close must be above the upper Keltner Channel for a setup to qualify. Each OHLC input has its own on/off toggle, which means you can customize the scan for different kinds of strength:
High above Upper KC → useful for spotting aggressive momentum names
Close above Upper KC → useful for confirming conviction into the close
Low above Upper KC → a much stricter requirement that can highlight exceptional trend persistence
Combine multiple OHLC conditions for even more selectivity 🎯
Built-in EMA trend confirmation
To improve signal quality, the script also includes optional EMA-based trend filters:
Fast EMA > Medium EMA
Price > Trend EMA
All three EMA lengths are adjustable, so traders can align the screener with their own strategy, timeframe, and level of strictness. 🔧
Persistence matters
One of the biggest strengths of this script is that it doesn’t just check for a bullish condition on one bar — it can require that strength to persist across a user-defined number of recent candles, adjustable from 1 to 100.
That makes it useful for finding:
fresh breakout strength
sustained bullish continuation
high-quality leaders maintaining pressure over time
This is what makes the script especially effective: it is designed to scan for strength plus persistence, not just isolated bullish spikes. 💡
Triangle lookback flexibility
The script also includes an optional triangle lookback feature.
When enabled, KC Signal can remain active if a Strong Uptrend Match triangle appeared within the last X bars (adjustable from 1 to 30).
This allows traders to:
catch strong setups that triggered recently
keep strong names on the radar for follow-through
avoid missing symbols that signaled a few bars ago but still matter today ✅
Screener-friendly outputs
For TradingView Screener, the script provides clean, useful outputs:
KC Signal
Fast EMA (10 EMA) Over Medium EMA (20 EMA)
Price Over Trend EMA (50 EMA)
When the full setup is met, the chart displays a Strong Uptrend Match triangle. In the screener, filtering for KC Signal = 1 helps quickly surface symbols currently meeting the full condition — or recently meeting it, if the lookback option is turned on. 📊
Best for traders who want to
find stocks showing strong momentum expansion
identify leaders with persistent bullish pressure
screen for names trading above key volatility envelopes
combine breakout behavior with trend confirmation
separate true leaders from weaker uptrends
Bottom line
KC OHLC Scan v0.1.5 is more than a simple uptrend indicator. It is a focused screening tool for traders who want to find stocks showing strength, expansion, confirmation, and persistence — all in one framework. 🔥
At its core, this script looks for symbols where recent candles are trading above the upper Keltner Channel — a sign that price is pushing beyond its normal volatility envelope and that buyers may be in strong control. When this behavior persists across multiple candles, it can reveal stocks with exceptional momentum and leadership. ⚡
Why this script is powerful
Most trend tools only ask whether price is above a moving average. This script goes further.
You can independently choose whether the Open, High, Low, and/or Close must be above the upper Keltner Channel for a setup to qualify. Each OHLC input has its own on/off toggle, which means you can customize the scan for different kinds of strength:
High above Upper KC → useful for spotting aggressive momentum names
Close above Upper KC → useful for confirming conviction into the close
Low above Upper KC → a much stricter requirement that can highlight exceptional trend persistence
Combine multiple OHLC conditions for even more selectivity 🎯
Built-in EMA trend confirmation
To improve signal quality, the script also includes optional EMA-based trend filters:
Fast EMA > Medium EMA
Price > Trend EMA
All three EMA lengths are adjustable, so traders can align the screener with their own strategy, timeframe, and level of strictness. 🔧
Persistence matters
One of the biggest strengths of this script is that it doesn’t just check for a bullish condition on one bar — it can require that strength to persist across a user-defined number of recent candles, adjustable from 1 to 100.
That makes it useful for finding:
fresh breakout strength
sustained bullish continuation
high-quality leaders maintaining pressure over time
This is what makes the script especially effective: it is designed to scan for strength plus persistence, not just isolated bullish spikes. 💡
Triangle lookback flexibility
The script also includes an optional triangle lookback feature.
When enabled, KC Signal can remain active if a Strong Uptrend Match triangle appeared within the last X bars (adjustable from 1 to 30).
This allows traders to:
catch strong setups that triggered recently
keep strong names on the radar for follow-through
avoid missing symbols that signaled a few bars ago but still matter today ✅
Screener-friendly outputs
For TradingView Screener, the script provides clean, useful outputs:
KC Signal
Fast EMA (10 EMA) Over Medium EMA (20 EMA)
Price Over Trend EMA (50 EMA)
When the full setup is met, the chart displays a Strong Uptrend Match triangle. In the screener, filtering for KC Signal = 1 helps quickly surface symbols currently meeting the full condition — or recently meeting it, if the lookback option is turned on. 📊
Best for traders who want to
find stocks showing strong momentum expansion
identify leaders with persistent bullish pressure
screen for names trading above key volatility envelopes
combine breakout behavior with trend confirmation
separate true leaders from weaker uptrends
Bottom line
KC OHLC Scan v0.1.5 is more than a simple uptrend indicator. It is a focused screening tool for traders who want to find stocks showing strength, expansion, confirmation, and persistence — all in one framework. 🔥
Nota Keluaran
**KC OHLC Scan v0.1.6** 📈🔎**KC OHLC Scan v0.1.6** is a momentum and trend-persistence screener built to help traders identify stocks showing **exceptional bullish strength**, not just ordinary upward drift.
This script focuses on a higher standard of trend quality by scanning for symbols where selected candle components are trading **above the upper Keltner Channel**. When price can maintain that position, it often reflects strong momentum, expansion beyond normal volatility, and sustained buyer control. ⚡
## What makes this script different
Most bullish scanners only check whether price is above a moving average.
This script goes further by allowing you to define exactly **how strong** a trend must be before it qualifies.
You can independently choose whether the following candle components must be above the **upper Keltner Channel**:
* **Open**
* **High**
* **Low**
* **Close**
Each of these conditions has its own on/off toggle, allowing the scan to be tailored to different styles:
* **High above Upper KC** can help identify aggressive momentum names
* **Close above Upper KC** can help confirm bullish conviction
* **Low above Upper KC** is a much stricter filter that can highlight exceptional trend persistence
* Combining multiple OHLC requirements increases selectivity and helps isolate stronger leaders 🎯
## Persistence filter
The script also includes a **Recent Candles Required** setting, allowing traders to require that the selected KC conditions hold true for multiple recent bars.
This helps separate:
* one-bar momentum spikes
* short-lived breakouts
* truly persistent trend leaders
The setting is adjustable from **1 to 100 bars**, giving traders flexibility to scan for both fresh strength and sustained continuation. 🔧
## Built-in trend confirmation
To improve quality, the script includes optional EMA-based confirmation filters:
* **Fast EMA > Medium EMA**
* **Price > Trend EMA**
All EMA lengths are adjustable, making the script adaptable to different timeframes and trading styles. This allows traders to combine **momentum expansion** with **trend structure confirmation** in a single framework. 📊
## Triangle lookback option
A **Strong Uptrend Match** is marked on the chart with a green upward triangle when all active conditions are satisfied.
The script also includes an optional **triangle lookback feature**, allowing **KC Signal** to remain active if a Strong Uptrend Match occurred within the last **X bars**. This can be useful for keeping recently triggered setups visible in the screener without requiring the signal to be present only on the current bar. ✅
## Exit signal included
To support trade management, the script also includes a **red downward exit triangle**.
The exit signal is triggered when **close crosses below an adjustable Exit EMA**, and it is designed to fire **only once after a green Strong Uptrend Match**. This helps reduce repeated exit signals and keeps the visual logic cleaner and more actionable. 🔻
## Screener outputs
For TradingView Pine Screener, the script provides clean and useful outputs:
* **KC Signal**
* **Fast EMA Over Medium EMA**
* **Price Over Trend EMA**
* **Exit Signal**
This makes it easy to scan, sort, and filter symbols based on both entry and exit conditions.
## Best for traders who want to
* find stocks with strong momentum expansion
* identify leaders trading above volatility envelopes
* screen for persistent bullish pressure
* combine KC strength with EMA trend confirmation
* monitor both entry quality and exit behavior in one tool
## Bottom line
**KC OHLC Scan v0.1.6** is more than a basic uptrend indicator. It is a focused momentum screener designed to help traders find stocks showing **strength, expansion, confirmation, and persistence** — with customizable entry logic and a built-in exit framework. 🚀

Penafian
Maklumat dan penerbitan adalah tidak bertujuan, dan tidak membentuk, nasihat atau cadangan kewangan, pelaburan, dagangan atau jenis lain yang diberikan atau disahkan oleh TradingView. Baca lebih dalam Terma Penggunaan.
Penafian
Maklumat dan penerbitan adalah tidak bertujuan, dan tidak membentuk, nasihat atau cadangan kewangan, pelaburan, dagangan atau jenis lain yang diberikan atau disahkan oleh TradingView. Baca lebih dalam Terma Penggunaan.