PDH PDL PWH PWL Boundary Response Register
OVERVIEW
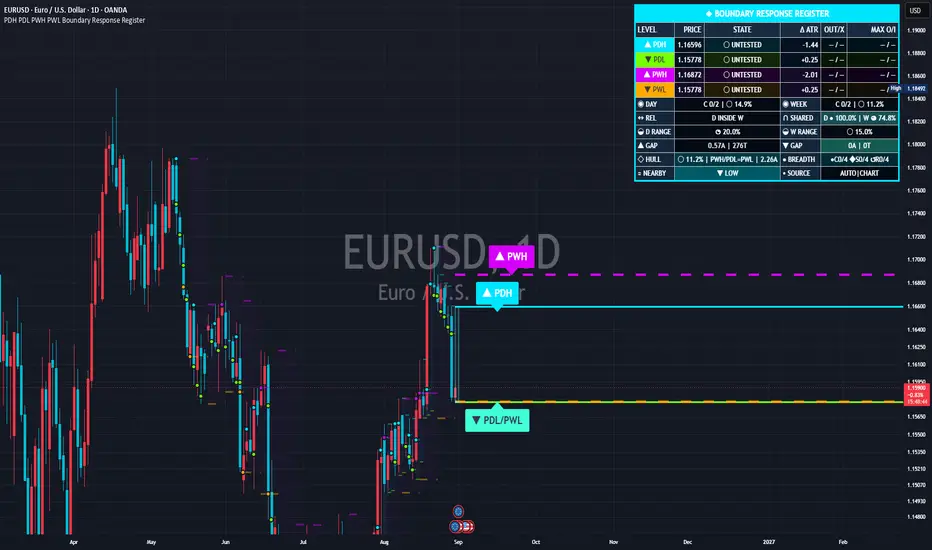
PDH PDL PWH PWL Boundary Response Register is an open-source prior-range research tool for time-based intraday charts and the 1D chart.
It plots four raw boundaries from completed higher-timeframe periods:
* PDH: Previous completed daily high
* PDL: Previous completed daily low
* PWH: Previous completed weekly high
* PWL: Previous completed weekly low
The script then records how the current day or week interacts with each boundary.
Its purpose is descriptive research. It does not calculate a conventional pivot ladder, assign support or resistance, predict direction, identify a target, generate entries or exits, or report win rates or profitability.
BOUNDARY LIFECYCLE
Each enabled boundary maintains an independent lifecycle for its active source period:
1. Untested
No confirmed contact has been recorded under the selected contact definition and tolerance.
2. Contacted
The boundary has received its first confirmed contact.
3. Sustained beyond
The configured number of consecutive confirmed closes finished beyond the boundary.
This state is independent of direct wick or body contact, so a price gap can satisfy the confirmed-close condition without first recording a conventional wick or body contact.
4. Re-entered
After Sustained beyond, a confirmed close crossed back through the boundary into the corresponding previous-day or previous-week range.
These states are factual classifications.
Sustained beyond does not mean that a breakout will continue. Re-entered does not mean that a reversal will follow.
CONTACT DEFINITIONS
The Contact definition input provides three research modes:
* Wick range: the confirmed bar's high-low range reaches the boundary.
* Candle body: the confirmed bar's open-close body reaches the boundary.
* Close-to-close span: two consecutive confirmed closes straddle the boundary, including a gap when the closes lie on opposite sides.
Contact tolerance can be configured as:
* Exact
* Ticks
* A fraction of the last completed daily ATR
These settings change the contact measurement rule. They do not change the underlying PDH, PDL, PWH, or PWL price.
POST-CONTACT RESPONSE REGISTER
After the first confirmed contact, the script can record an independent response profile for each boundary.
The measurements include:
* First-contact form: Gap beyond, Close through, Wick through, or Boundary touch.
* Confirmed post-contact observation count.
* Outside-close residency: the percentage of confirmed post-contact observations that closed beyond the boundary.
* Close-side recross count: the number of confirmed changes between the inside and outside sides of the boundary.
* Maximum outside excursion.
* Maximum return into the corresponding prior range.
* Chart bars from first contact to Sustained beyond.
* Chart bars from Sustained beyond to the first Re-entered event.
The register abbreviates two response fields:
OUT/X
* OUT: outside-close residency percentage.
* X: confirmed close-side recross count.
MAX O/I
* O: maximum outside excursion.
* I: maximum return into the corresponding prior range.
Maximum excursions are normalized with a daily ATR value frozen at the relevant daily or weekly reset.
These values describe the currently active source period. They are not historical probabilities, confidence scores, success rates, expectancy measurements, or performance statistics.
CROSS-HORIZON RANGE GEOMETRY
The register also measures how the completed daily and weekly ranges relate to each other.
Its cross-horizon fields include:
* The current confirmed close's coordinate inside the previous-day range.
* The current confirmed close's coordinate inside the previous-week range.
* Daily contact coverage for PDH and PDL.
* Weekly contact coverage for PWH and PWL.
* Bar separation between the two boundaries when both boundaries in a pair have been contacted.
* Daily and weekly range containment or overlap.
* The mathematical intersection of the previous daily and weekly ranges.
* The shared interval as a percentage of each prior range.
* Current day range use relative to the previous completed daily range.
* Current week range use relative to the previous completed weekly range.
* PDH/PWH separation in completed daily ATR units and ticks.
* PDL/PWL separation in completed daily ATR units and ticks.
* Configurable nearby-pair detection.
* A four-level hull formed by the outermost values of PDH, PDL, PWH, and PWL.
* The current close's coordinate inside that hull.
* The hull's upper and lower boundary anchors.
* The hull width in completed daily ATR units.
* State breadth across all enabled boundaries.
State breadth reports how many enabled boundaries have reached:
* C: Contacted
* S: Sustained beyond
* R: Re-entered
The shared corridor, nearby pairs, range relation, and four-level hull are geometric references.
The script does not classify them as support, resistance, liquidity, supply, demand, accumulation, distribution, institutional levels, or trade setups.
VISUAL OUTPUT
The default presentation includes:
* Distinct PDH, PDL, PWH, and PWL lines.
* Different default styling for daily and weekly boundaries.
* Optional prior-day and prior-week range ribbons.
* Optional shared-corridor highlighting.
* Optional nearby-pair highlighting.
* Historical daily and weekly segments with adjustable retention.
* Reduced emphasis for completed historical segments.
* Optional first-contact or full-lifecycle event marks.
* Compact right-edge identification tags.
* Automatic merging of nearby daily and weekly tags.
* Optional dotted leaders when a display tag is displaced from its exact boundary price.
* A fixed Boundary Response Register in the selected chart corner.
The right-edge tags use the currently visible chart range, visible bar count, completed daily ATR, and tick-size floors only to resolve annotation spacing and future-side placement.
The tags can reposition when the chart is scrolled or zoomed.
This visual repositioning does not change:
* The exact PDH, PDL, PWH, or PWL prices.
* Horizontal boundary-line prices.
* Lifecycle states.
* Post-contact response measurements.
* Range geometry.
* Alert conditions.
Exact prices and full state details remain available in the Boundary Response Register and label tooltips.
DATA HANDLING AND REALTIME BEHAVIOR
PDH, PDL, PWH, PWL, and the ATR normalization value are requested from completed higher-timeframe bars.
The expressions used with higher-timeframe lookahead are offset by one completed higher-timeframe bar before being used. The four active boundary prices therefore do not change during their corresponding current day or week.
Lifecycle and response events are committed on confirmed chart bars.
The combined dynamic alert also uses once-per-bar-close frequency.
Some current-context fields can continue changing while the realtime bar is open, including:
* Current close distance from each boundary.
* Current day range use.
* Current week range use.
* Developing current-period high and low values.
Those current-context fields are distinct from confirmed lifecycle history.
SOURCE MODES
Three reference-data modes are available:
Automatic
Uses the chart context on standard charts and standard-symbol candles on non-standard charts.
Chart context
Preserves the current chart's ticker context and modifiers.
Standard candles
Requests standard market candles without non-standard chart construction or other ticker modifiers.
When the selected event source has no usable bar aligned with the current chart timestamp, event evaluation pauses instead of treating an older forward-filled candle as a new observation.
NON-STANDARD CHARTS
Heikin Ashi, Renko, Kagi, Line Break, Point and Figure, Range, and other non-standard charts can contain synthetic OHLC values.
The completed daily and weekly boundaries remain available, but lifecycle events, current-range progress, and related alerts are disabled by default on non-standard charts.
Users can enable non-standard-chart event evaluation only for explicit research.
SUPPORTED TIMEFRAMES
The script supports:
* Time-based intraday charts.
* The 1D chart.
Tick charts and timeframes above 1D are excluded because their relationship with the requested event data would require ambiguous lower-timeframe reconstruction.
An on-chart notice is displayed when the selected timeframe is unsupported.
IMPORTANT 1D LIMITATION
On the 1D chart, the daily boundary lifecycle resets on each new daily bar.
PDH and PDL therefore cannot accumulate more than one daily close before the next daily reset.
When Closes required beyond is set above 1, the multi-close Sustained beyond state for PDH and PDL is primarily meaningful on intraday charts.
PWH and PWL can still accumulate multiple daily closes during the active week.
For full daily-boundary lifecycle and post-contact research, a time-based intraday chart is recommended.
ALERTS
Factual alert conditions are available for:
* First confirmed contact of any enabled boundary.
* First confirmed contact of each individual boundary.
* Sustained beyond for any enabled boundary.
* Sustained beyond for each individual boundary.
* Re-entered for any enabled boundary.
* Re-entered for each individual boundary.
* Formation of a nearby PDH/PWH pair.
* Formation of a nearby PDL/PWL pair.
* Completion of the daily contact pair.
* Completion of the weekly contact pair.
* A configurable outside-close residency threshold.
* A configurable maximum outside-excursion threshold.
* A combined confirmed-bar alert() message that consolidates simultaneous events.
Alerts report observed conditions only.
They do not instruct the user to buy, sell, enter, exit, place a stop, or select a profit target.
HOW TO USE
1. Apply the script to a standard time-based intraday chart or the 1D chart.
2. Select Automatic, Chart context, or Standard candles according to the data context being researched.
3. Enable daily and weekly boundaries and select the amount of historical retention.
4. Choose the contact definition and tolerance.
5. Select the number of confirmed closes required for Sustained beyond.
6. Read each boundary's lifecycle together with OUT/X and MAX O/I rather than interpreting a horizontal line in isolation.
7. Use the lower register rows to compare daily and weekly range geometry, shared overlap, current range use, pair spacing, hull position, and state breadth.
8. Adjust nearby-pair thresholds, historical event-mark density, right-edge tag content, and register size for the symbol and timeframe.
9. Use Market Replay and multiple symbols to verify customized settings before creating alerts.
WHY THIS IS A SEPARATE PUBLICATION
This study is separate from Previous Day Pivot Path - Intraday Support Resistance because the two scripts address different research questions and use different analytical structures.
Previous Day Pivot Path is a previous-day pivot-formula and arrival-order study. It calculates P, R, and S levels, supports pivot formula families, records first-arrival rank, distinguishes reached and unreached levels, and can emphasize the next unreached level. PDH and PDL are optional context references in that study.
Boundary Response Register calculates no:
* P/R/S ladder.
* CPR.
* Pivot formula family.
* Pivot arrival rank.
* Reached-versus-unreached path.
* Next unreached level.
* Next target.
Its four primary objects are the raw completed-period boundaries PDH, PDL, PWH, and PWL.
It tracks:
* Their independent lifecycle.
* Their post-contact response measurements.
* Daily and weekly range geometry.
* Shared range overlap.
* High-pair and low-pair spacing.
* Four-level hull position.
* State breadth.
Combining these functions into the existing pivot study would materially change that publication's purpose, supported horizon, default output, settings structure, alerts, and user workflow.
This is therefore a separate research tool rather than a minor visual variation or version update.
DISTINGUISHING DESIGN
Many previous-period high and low tools focus on one or more of the following:
* Drawing horizontal lines only.
* Tested or untested status.
* Swept or unswept status.
* Previous-month levels.
* Range midpoints or equilibrium levels.
* Nearest-target labels.
* Directional bias.
* Historical reach or break rates.
* Trade-plan instructions.
This implementation instead combines:
* Four raw completed daily and weekly boundaries.
* A four-stage lifecycle for each boundary.
* Confirmed post-contact response measurements.
* Frozen-ATR normalization of outside and inside excursions.
* Daily and weekly range-intersection geometry.
* Contact-pair timing.
* A four-level hull.
* State breadth.
* Neutral confirmed-bar alerts.
* Scale-aware annotation collision management.
The common PDH, PDL, PWH, and PWL inputs are objective completed-period prices.
The distinguishing purpose of this implementation is the state, response, geometry, source-handling, and visualization framework built around those four boundaries.
LIMITATIONS
* OHLC bars do not reveal the exact tick-by-tick sequence inside a candle.
* The script does not invent an intrabar event order.
* Contact results depend on the selected Wick range, Candle body, or Close-to-close span definition.
* Contact results also depend on the selected tolerance.
* Multiple events confirmed on the same chart bar are simultaneous at chart resolution unless the available data proves otherwise.
* Sustained beyond is a configurable confirmed-close condition, not proof that a move will continue.
* Re-entered is a recorded return through a boundary, not proof of reversal.
* ATR-normalized values depend on the symbol's completed daily data and the selected ATR length.
* Current day and week range-use values are incomplete while the current period is developing.
* The first loaded day or week can contain partial history if the chart dataset begins after that source period started.
* Session definitions, holidays, early closes, broker feeds, exchange data, and ticker modifiers can change completed-period OHLC values.
* Synthetic charts can produce event timing different from standard market candles.
* Historical drawing retention is limited by the selected settings and TradingView object limits.
* The visual annotation rail can move when the visible chart window changes.
* The script provides no entries, exits, targets, stops, position sizing, probability forecasts, or performance claims.
OPEN-SOURCE IMPLEMENTATION
The script is written in Pine Script v6 using Pine built-ins and independently implemented state, measurement, and drawing logic.
It imports no external libraries.
The source is published openly so users can inspect the calculations and adapt the research settings within TradingView's rules.
PDH PDL PWH PWL Boundary Response Register is an open-source prior-range research tool for time-based intraday charts and the 1D chart.
It plots four raw boundaries from completed higher-timeframe periods:
* PDH: Previous completed daily high
* PDL: Previous completed daily low
* PWH: Previous completed weekly high
* PWL: Previous completed weekly low
The script then records how the current day or week interacts with each boundary.
Its purpose is descriptive research. It does not calculate a conventional pivot ladder, assign support or resistance, predict direction, identify a target, generate entries or exits, or report win rates or profitability.
BOUNDARY LIFECYCLE
Each enabled boundary maintains an independent lifecycle for its active source period:
1. Untested
No confirmed contact has been recorded under the selected contact definition and tolerance.
2. Contacted
The boundary has received its first confirmed contact.
3. Sustained beyond
The configured number of consecutive confirmed closes finished beyond the boundary.
This state is independent of direct wick or body contact, so a price gap can satisfy the confirmed-close condition without first recording a conventional wick or body contact.
4. Re-entered
After Sustained beyond, a confirmed close crossed back through the boundary into the corresponding previous-day or previous-week range.
These states are factual classifications.
Sustained beyond does not mean that a breakout will continue. Re-entered does not mean that a reversal will follow.
CONTACT DEFINITIONS
The Contact definition input provides three research modes:
* Wick range: the confirmed bar's high-low range reaches the boundary.
* Candle body: the confirmed bar's open-close body reaches the boundary.
* Close-to-close span: two consecutive confirmed closes straddle the boundary, including a gap when the closes lie on opposite sides.
Contact tolerance can be configured as:
* Exact
* Ticks
* A fraction of the last completed daily ATR
These settings change the contact measurement rule. They do not change the underlying PDH, PDL, PWH, or PWL price.
POST-CONTACT RESPONSE REGISTER
After the first confirmed contact, the script can record an independent response profile for each boundary.
The measurements include:
* First-contact form: Gap beyond, Close through, Wick through, or Boundary touch.
* Confirmed post-contact observation count.
* Outside-close residency: the percentage of confirmed post-contact observations that closed beyond the boundary.
* Close-side recross count: the number of confirmed changes between the inside and outside sides of the boundary.
* Maximum outside excursion.
* Maximum return into the corresponding prior range.
* Chart bars from first contact to Sustained beyond.
* Chart bars from Sustained beyond to the first Re-entered event.
The register abbreviates two response fields:
OUT/X
* OUT: outside-close residency percentage.
* X: confirmed close-side recross count.
MAX O/I
* O: maximum outside excursion.
* I: maximum return into the corresponding prior range.
Maximum excursions are normalized with a daily ATR value frozen at the relevant daily or weekly reset.
These values describe the currently active source period. They are not historical probabilities, confidence scores, success rates, expectancy measurements, or performance statistics.
CROSS-HORIZON RANGE GEOMETRY
The register also measures how the completed daily and weekly ranges relate to each other.
Its cross-horizon fields include:
* The current confirmed close's coordinate inside the previous-day range.
* The current confirmed close's coordinate inside the previous-week range.
* Daily contact coverage for PDH and PDL.
* Weekly contact coverage for PWH and PWL.
* Bar separation between the two boundaries when both boundaries in a pair have been contacted.
* Daily and weekly range containment or overlap.
* The mathematical intersection of the previous daily and weekly ranges.
* The shared interval as a percentage of each prior range.
* Current day range use relative to the previous completed daily range.
* Current week range use relative to the previous completed weekly range.
* PDH/PWH separation in completed daily ATR units and ticks.
* PDL/PWL separation in completed daily ATR units and ticks.
* Configurable nearby-pair detection.
* A four-level hull formed by the outermost values of PDH, PDL, PWH, and PWL.
* The current close's coordinate inside that hull.
* The hull's upper and lower boundary anchors.
* The hull width in completed daily ATR units.
* State breadth across all enabled boundaries.
State breadth reports how many enabled boundaries have reached:
* C: Contacted
* S: Sustained beyond
* R: Re-entered
The shared corridor, nearby pairs, range relation, and four-level hull are geometric references.
The script does not classify them as support, resistance, liquidity, supply, demand, accumulation, distribution, institutional levels, or trade setups.
VISUAL OUTPUT
The default presentation includes:
* Distinct PDH, PDL, PWH, and PWL lines.
* Different default styling for daily and weekly boundaries.
* Optional prior-day and prior-week range ribbons.
* Optional shared-corridor highlighting.
* Optional nearby-pair highlighting.
* Historical daily and weekly segments with adjustable retention.
* Reduced emphasis for completed historical segments.
* Optional first-contact or full-lifecycle event marks.
* Compact right-edge identification tags.
* Automatic merging of nearby daily and weekly tags.
* Optional dotted leaders when a display tag is displaced from its exact boundary price.
* A fixed Boundary Response Register in the selected chart corner.
The right-edge tags use the currently visible chart range, visible bar count, completed daily ATR, and tick-size floors only to resolve annotation spacing and future-side placement.
The tags can reposition when the chart is scrolled or zoomed.
This visual repositioning does not change:
* The exact PDH, PDL, PWH, or PWL prices.
* Horizontal boundary-line prices.
* Lifecycle states.
* Post-contact response measurements.
* Range geometry.
* Alert conditions.
Exact prices and full state details remain available in the Boundary Response Register and label tooltips.
DATA HANDLING AND REALTIME BEHAVIOR
PDH, PDL, PWH, PWL, and the ATR normalization value are requested from completed higher-timeframe bars.
The expressions used with higher-timeframe lookahead are offset by one completed higher-timeframe bar before being used. The four active boundary prices therefore do not change during their corresponding current day or week.
Lifecycle and response events are committed on confirmed chart bars.
The combined dynamic alert also uses once-per-bar-close frequency.
Some current-context fields can continue changing while the realtime bar is open, including:
* Current close distance from each boundary.
* Current day range use.
* Current week range use.
* Developing current-period high and low values.
Those current-context fields are distinct from confirmed lifecycle history.
SOURCE MODES
Three reference-data modes are available:
Automatic
Uses the chart context on standard charts and standard-symbol candles on non-standard charts.
Chart context
Preserves the current chart's ticker context and modifiers.
Standard candles
Requests standard market candles without non-standard chart construction or other ticker modifiers.
When the selected event source has no usable bar aligned with the current chart timestamp, event evaluation pauses instead of treating an older forward-filled candle as a new observation.
NON-STANDARD CHARTS
Heikin Ashi, Renko, Kagi, Line Break, Point and Figure, Range, and other non-standard charts can contain synthetic OHLC values.
The completed daily and weekly boundaries remain available, but lifecycle events, current-range progress, and related alerts are disabled by default on non-standard charts.
Users can enable non-standard-chart event evaluation only for explicit research.
SUPPORTED TIMEFRAMES
The script supports:
* Time-based intraday charts.
* The 1D chart.
Tick charts and timeframes above 1D are excluded because their relationship with the requested event data would require ambiguous lower-timeframe reconstruction.
An on-chart notice is displayed when the selected timeframe is unsupported.
IMPORTANT 1D LIMITATION
On the 1D chart, the daily boundary lifecycle resets on each new daily bar.
PDH and PDL therefore cannot accumulate more than one daily close before the next daily reset.
When Closes required beyond is set above 1, the multi-close Sustained beyond state for PDH and PDL is primarily meaningful on intraday charts.
PWH and PWL can still accumulate multiple daily closes during the active week.
For full daily-boundary lifecycle and post-contact research, a time-based intraday chart is recommended.
ALERTS
Factual alert conditions are available for:
* First confirmed contact of any enabled boundary.
* First confirmed contact of each individual boundary.
* Sustained beyond for any enabled boundary.
* Sustained beyond for each individual boundary.
* Re-entered for any enabled boundary.
* Re-entered for each individual boundary.
* Formation of a nearby PDH/PWH pair.
* Formation of a nearby PDL/PWL pair.
* Completion of the daily contact pair.
* Completion of the weekly contact pair.
* A configurable outside-close residency threshold.
* A configurable maximum outside-excursion threshold.
* A combined confirmed-bar alert() message that consolidates simultaneous events.
Alerts report observed conditions only.
They do not instruct the user to buy, sell, enter, exit, place a stop, or select a profit target.
HOW TO USE
1. Apply the script to a standard time-based intraday chart or the 1D chart.
2. Select Automatic, Chart context, or Standard candles according to the data context being researched.
3. Enable daily and weekly boundaries and select the amount of historical retention.
4. Choose the contact definition and tolerance.
5. Select the number of confirmed closes required for Sustained beyond.
6. Read each boundary's lifecycle together with OUT/X and MAX O/I rather than interpreting a horizontal line in isolation.
7. Use the lower register rows to compare daily and weekly range geometry, shared overlap, current range use, pair spacing, hull position, and state breadth.
8. Adjust nearby-pair thresholds, historical event-mark density, right-edge tag content, and register size for the symbol and timeframe.
9. Use Market Replay and multiple symbols to verify customized settings before creating alerts.
WHY THIS IS A SEPARATE PUBLICATION
This study is separate from Previous Day Pivot Path - Intraday Support Resistance because the two scripts address different research questions and use different analytical structures.
Previous Day Pivot Path is a previous-day pivot-formula and arrival-order study. It calculates P, R, and S levels, supports pivot formula families, records first-arrival rank, distinguishes reached and unreached levels, and can emphasize the next unreached level. PDH and PDL are optional context references in that study.
Boundary Response Register calculates no:
* P/R/S ladder.
* CPR.
* Pivot formula family.
* Pivot arrival rank.
* Reached-versus-unreached path.
* Next unreached level.
* Next target.
Its four primary objects are the raw completed-period boundaries PDH, PDL, PWH, and PWL.
It tracks:
* Their independent lifecycle.
* Their post-contact response measurements.
* Daily and weekly range geometry.
* Shared range overlap.
* High-pair and low-pair spacing.
* Four-level hull position.
* State breadth.
Combining these functions into the existing pivot study would materially change that publication's purpose, supported horizon, default output, settings structure, alerts, and user workflow.
This is therefore a separate research tool rather than a minor visual variation or version update.
DISTINGUISHING DESIGN
Many previous-period high and low tools focus on one or more of the following:
* Drawing horizontal lines only.
* Tested or untested status.
* Swept or unswept status.
* Previous-month levels.
* Range midpoints or equilibrium levels.
* Nearest-target labels.
* Directional bias.
* Historical reach or break rates.
* Trade-plan instructions.
This implementation instead combines:
* Four raw completed daily and weekly boundaries.
* A four-stage lifecycle for each boundary.
* Confirmed post-contact response measurements.
* Frozen-ATR normalization of outside and inside excursions.
* Daily and weekly range-intersection geometry.
* Contact-pair timing.
* A four-level hull.
* State breadth.
* Neutral confirmed-bar alerts.
* Scale-aware annotation collision management.
The common PDH, PDL, PWH, and PWL inputs are objective completed-period prices.
The distinguishing purpose of this implementation is the state, response, geometry, source-handling, and visualization framework built around those four boundaries.
LIMITATIONS
* OHLC bars do not reveal the exact tick-by-tick sequence inside a candle.
* The script does not invent an intrabar event order.
* Contact results depend on the selected Wick range, Candle body, or Close-to-close span definition.
* Contact results also depend on the selected tolerance.
* Multiple events confirmed on the same chart bar are simultaneous at chart resolution unless the available data proves otherwise.
* Sustained beyond is a configurable confirmed-close condition, not proof that a move will continue.
* Re-entered is a recorded return through a boundary, not proof of reversal.
* ATR-normalized values depend on the symbol's completed daily data and the selected ATR length.
* Current day and week range-use values are incomplete while the current period is developing.
* The first loaded day or week can contain partial history if the chart dataset begins after that source period started.
* Session definitions, holidays, early closes, broker feeds, exchange data, and ticker modifiers can change completed-period OHLC values.
* Synthetic charts can produce event timing different from standard market candles.
* Historical drawing retention is limited by the selected settings and TradingView object limits.
* The visual annotation rail can move when the visible chart window changes.
* The script provides no entries, exits, targets, stops, position sizing, probability forecasts, or performance claims.
OPEN-SOURCE IMPLEMENTATION
The script is written in Pine Script v6 using Pine built-ins and independently implemented state, measurement, and drawing logic.
It imports no external libraries.
The source is published openly so users can inspect the calculations and adapt the research settings within TradingView's rules.

Penafian
Maklumat dan penerbitan adalah tidak bertujuan, dan tidak membentuk, nasihat atau cadangan kewangan, pelaburan, dagangan atau jenis lain yang diberikan atau disahkan oleh TradingView. Baca lebih dalam Terma Penggunaan.
Penafian
Maklumat dan penerbitan adalah tidak bertujuan, dan tidak membentuk, nasihat atau cadangan kewangan, pelaburan, dagangan atau jenis lain yang diberikan atau disahkan oleh TradingView. Baca lebih dalam Terma Penggunaan.