OPEN-SOURCE SCRIPT
Game Theory Strategic Indicator - Archery & Horse Riding Model
# Game Theory Strategic Indicator - Archery & Horse Riding Model
## Overview
This indicator applies rigorous game theory mathematics to market analysis, modeling price action as a strategic two-player game between buyers and sellers. The methodology draws from economic game theory, evolutionary dynamics, and zero-sum game optimization.
## Theoretical Foundation
The indicator implements five core game theory concepts:
**1. Expected Utility (Mixed Strategies)**
Calculates E = p×U₁ + (1-p)×U₂ where:
- p = probability distribution based on volume dynamics
- U₁, U₂ = utility payoffs for aggressive vs defensive strategies
- Uses RSI momentum and ATR volatility to quantify payoffs
**2. Nash Equilibrium Detection**
Identifies market states where ui(σᵢ*, σ₋ᵢ*) ≥ ui(σᵢ, σ₋ᵢ*):
- Measures when no participant can improve by changing strategy
- Highlighted with yellow background zones
- Signals reduced edge environments (avoid trading)
**3. Replicator Dynamics**
Models evolutionary strategy adaptation: dx/dt = x(f(x) - φ(x))
- Tracks frequency changes in bullish vs bearish strategies
- Shows which approach is gaining evolutionary fitness
- Purple line indicates strategy evolution trend
**4. Minimax Algorithm**
Implements zero-sum game optimal strategy L(x,y):
- Calculates win/loss ratio over lookback period
- Values > 1.0 suggest favorable risk/reward
- Orange line shows deviation from neutral state
**5. Best Response Function**
Determines optimal action maximizing ui(aᵢ, a₋ᵢ):
- Compares buyer vs seller expected utilities
- Generates primary long/short signals
- Confidence weighted by utility differential
## Visual Elements
**Chart Plots:**
- **Blue Line (Utility Differential)**: Buyer utility minus seller utility. Positive favors longs, negative favors shorts
- **Purple Line (Replicator Dynamics)**: Rate of strategy evolution. Rising = bullish strategies gaining fitness
- **Orange Line (Minimax Deviation)**: Zero-sum game value. Above zero = favorable conditions
- **Pink Area (Mixed Strategy Bias)**: Probability-weighted strategy preference
- **Yellow Background**: Nash equilibrium zones where no player has edge
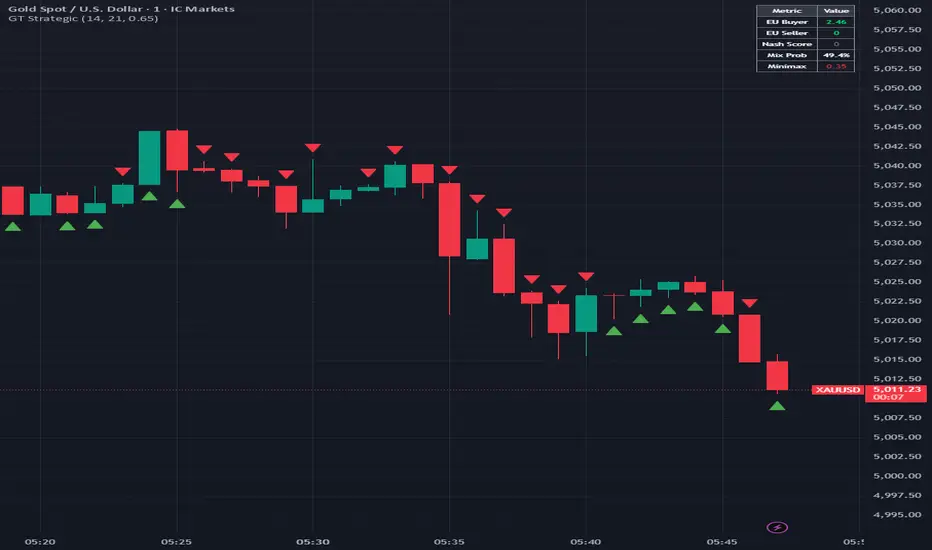
**Signals:**
- **Green Triangle Up**: Long signal - buyer utility dominates outside equilibrium
- **Red Triangle Down**: Short signal - seller utility dominates outside equilibrium
- **Yellow Diamond**: Equilibrium warning - reduced edge state
**Info Table (Top Right):**
- EU Buyer/Seller: Current expected utilities
- Nash Score: Equilibrium strength (>0.65 = equilibrium)
- Mix Prob: Volume-based probability distribution
- Minimax: Win/loss ratio indicator
## Strategy Metaphors
**Archery (Buyer Strategy)**: Represents precision attacks - targeted entries at optimal risk/reward points, high accuracy required
**Horse Riding (Seller Strategy)**: Represents mobile defense - flexible positioning, quick exits, adaptive to changing terrain
## Parameters
- **Strategy Period (14)**: Lookback for RSI and ATR calculations
- **Mixed Strategy Length (21)**: Period for minimax win/loss analysis
- **Nash Equilibrium Threshold (0.65)**: Minimum score to identify equilibrium (0.5-0.9)
- **Show Trade Signals**: Toggle buy/sell arrows
- **Show Equilibrium Zones**: Toggle background highlighting
## How to Use
1. **Trend Trading**: Take long signals when utility differential (blue) is rising and no equilibrium zone present
2. **Counter-Trend**: Take signals when replicator dynamics (purple) diverges from price
3. **Risk Management**: Avoid trading during yellow equilibrium zones - market has no clear edge
4. **Confirmation**: Best signals occur when minimax > 1.0 and best response aligns with utility differential
5. **Monitoring**: Watch info table for real-time utility balance and equilibrium status
## Alerts
Three alert conditions available:
- **GT Long Signal**: Buyer utility dominates, composite score > 0.5
- **GT Short Signal**: Seller utility dominates, composite score < -0.5
- **Nash Equilibrium**: Market reaches balanced state, avoid new entries
## Mathematical Rigor
All calculations use proper game theory formulations:
- Payoff functions normalized by volatility
- Probability distributions bounded [0,1]
- Zero-division protection implemented
- Utilities properly weighted in composite score
## Originality Statement
This indicator is original work implementing classical game theory mathematics in a novel market analysis framework. The code, calculations, and interpretation methodology are entirely my own creation. No external scripts were copied or modified.
## Disclaimer
This indicator is for educational purposes. Game theory provides a framework for analyzing strategic interaction but does not guarantee profitable trading. Always use proper risk management, test thoroughly, and understand that past performance does not indicate future results.
---
**Educational Resource**: For deeper understanding of game theory in economics, see Nash (1950) "Equilibrium Points in N-Person Games" and Maynard Smith (1982) "Evolution and the Theory of Games"
```
---
## Overview
This indicator applies rigorous game theory mathematics to market analysis, modeling price action as a strategic two-player game between buyers and sellers. The methodology draws from economic game theory, evolutionary dynamics, and zero-sum game optimization.
## Theoretical Foundation
The indicator implements five core game theory concepts:
**1. Expected Utility (Mixed Strategies)**
Calculates E = p×U₁ + (1-p)×U₂ where:
- p = probability distribution based on volume dynamics
- U₁, U₂ = utility payoffs for aggressive vs defensive strategies
- Uses RSI momentum and ATR volatility to quantify payoffs
**2. Nash Equilibrium Detection**
Identifies market states where ui(σᵢ*, σ₋ᵢ*) ≥ ui(σᵢ, σ₋ᵢ*):
- Measures when no participant can improve by changing strategy
- Highlighted with yellow background zones
- Signals reduced edge environments (avoid trading)
**3. Replicator Dynamics**
Models evolutionary strategy adaptation: dx/dt = x(f(x) - φ(x))
- Tracks frequency changes in bullish vs bearish strategies
- Shows which approach is gaining evolutionary fitness
- Purple line indicates strategy evolution trend
**4. Minimax Algorithm**
Implements zero-sum game optimal strategy L(x,y):
- Calculates win/loss ratio over lookback period
- Values > 1.0 suggest favorable risk/reward
- Orange line shows deviation from neutral state
**5. Best Response Function**
Determines optimal action maximizing ui(aᵢ, a₋ᵢ):
- Compares buyer vs seller expected utilities
- Generates primary long/short signals
- Confidence weighted by utility differential
## Visual Elements
**Chart Plots:**
- **Blue Line (Utility Differential)**: Buyer utility minus seller utility. Positive favors longs, negative favors shorts
- **Purple Line (Replicator Dynamics)**: Rate of strategy evolution. Rising = bullish strategies gaining fitness
- **Orange Line (Minimax Deviation)**: Zero-sum game value. Above zero = favorable conditions
- **Pink Area (Mixed Strategy Bias)**: Probability-weighted strategy preference
- **Yellow Background**: Nash equilibrium zones where no player has edge
**Signals:**
- **Green Triangle Up**: Long signal - buyer utility dominates outside equilibrium
- **Red Triangle Down**: Short signal - seller utility dominates outside equilibrium
- **Yellow Diamond**: Equilibrium warning - reduced edge state
**Info Table (Top Right):**
- EU Buyer/Seller: Current expected utilities
- Nash Score: Equilibrium strength (>0.65 = equilibrium)
- Mix Prob: Volume-based probability distribution
- Minimax: Win/loss ratio indicator
## Strategy Metaphors
**Archery (Buyer Strategy)**: Represents precision attacks - targeted entries at optimal risk/reward points, high accuracy required
**Horse Riding (Seller Strategy)**: Represents mobile defense - flexible positioning, quick exits, adaptive to changing terrain
## Parameters
- **Strategy Period (14)**: Lookback for RSI and ATR calculations
- **Mixed Strategy Length (21)**: Period for minimax win/loss analysis
- **Nash Equilibrium Threshold (0.65)**: Minimum score to identify equilibrium (0.5-0.9)
- **Show Trade Signals**: Toggle buy/sell arrows
- **Show Equilibrium Zones**: Toggle background highlighting
## How to Use
1. **Trend Trading**: Take long signals when utility differential (blue) is rising and no equilibrium zone present
2. **Counter-Trend**: Take signals when replicator dynamics (purple) diverges from price
3. **Risk Management**: Avoid trading during yellow equilibrium zones - market has no clear edge
4. **Confirmation**: Best signals occur when minimax > 1.0 and best response aligns with utility differential
5. **Monitoring**: Watch info table for real-time utility balance and equilibrium status
## Alerts
Three alert conditions available:
- **GT Long Signal**: Buyer utility dominates, composite score > 0.5
- **GT Short Signal**: Seller utility dominates, composite score < -0.5
- **Nash Equilibrium**: Market reaches balanced state, avoid new entries
## Mathematical Rigor
All calculations use proper game theory formulations:
- Payoff functions normalized by volatility
- Probability distributions bounded [0,1]
- Zero-division protection implemented
- Utilities properly weighted in composite score
## Originality Statement
This indicator is original work implementing classical game theory mathematics in a novel market analysis framework. The code, calculations, and interpretation methodology are entirely my own creation. No external scripts were copied or modified.
## Disclaimer
This indicator is for educational purposes. Game theory provides a framework for analyzing strategic interaction but does not guarantee profitable trading. Always use proper risk management, test thoroughly, and understand that past performance does not indicate future results.
---
**Educational Resource**: For deeper understanding of game theory in economics, see Nash (1950) "Equilibrium Points in N-Person Games" and Maynard Smith (1982) "Evolution and the Theory of Games"
```
---
Skrip sumber terbuka
Dalam semangat TradingView sebenar, pencipta skrip ini telah menjadikannya sumber terbuka, jadi pedagang boleh menilai dan mengesahkan kefungsiannya. Terima kasih kepada penulis! Walaupuan anda boleh menggunakan secara percuma, ingat bahawa penerbitan semula kod ini tertakluk kepada Peraturan Dalaman.

Penafian
Maklumat dan penerbitan adalah tidak bertujuan, dan tidak membentuk, nasihat atau cadangan kewangan, pelaburan, dagangan atau jenis lain yang diberikan atau disahkan oleh TradingView. Baca lebih dalam Terma Penggunaan.
Skrip sumber terbuka
Dalam semangat TradingView sebenar, pencipta skrip ini telah menjadikannya sumber terbuka, jadi pedagang boleh menilai dan mengesahkan kefungsiannya. Terima kasih kepada penulis! Walaupuan anda boleh menggunakan secara percuma, ingat bahawa penerbitan semula kod ini tertakluk kepada Peraturan Dalaman.
Penafian
Maklumat dan penerbitan adalah tidak bertujuan, dan tidak membentuk, nasihat atau cadangan kewangan, pelaburan, dagangan atau jenis lain yang diberikan atau disahkan oleh TradingView. Baca lebih dalam Terma Penggunaan.