OPEN-SOURCE SCRIPT
AetherEdge - Principal Component Analysis
🖊️ Overview
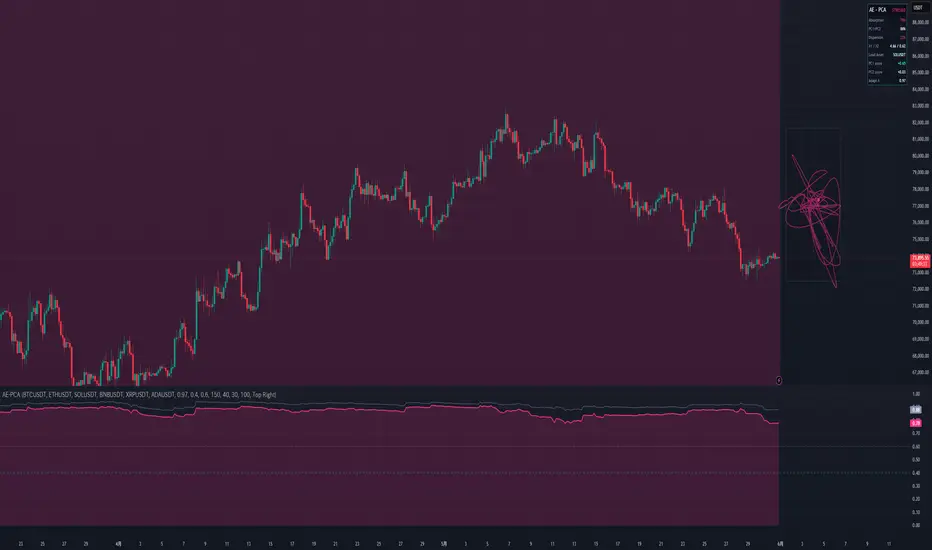
AE-PCA extracts the market's eigen-state from the correlation structure of a basket of assets. It builds a rolling correlation matrix online and extracts the leading principal components — PC1 (market factor), PC2 (rotation/dispersion) — via power iteration with deflation. From the eigenvalues it derives the Absorption Ratio (λ₁/N) — the share of basket variance explained by one factor — which reveals, at a glance, the "everything moves together" systemic fragility of the market. The eigenbasis continuously re-orients each bar to the current correlation structure.
🔶 Key Features
Online PCA engine — builds a rolling correlation matrix with forgetting and extracts the top two principal components by power iteration (heavy use of the matrix type).
Absorption Ratio (systemic stress) — λ₁/N quantifies market concentration = fragility; sharp rises capture the "correlation convergence" that precedes crashes.
Self-evolving eigenbasis — eigenvectors are warm-started and re-converged each bar, tracking shifts in correlation smoothly (subspace tracking) with sign continuity preserved.
Phase-space comet — projects the live return vector onto PC1/PC2 and traces the market's path through factor space as a comet trail on a floating canvas to the right of the chart.
Factor loadings — identifies the asset that loads most heavily on PC1 (the one leading the market).
Dispersion gauge — 1 − Absorption Ratio shows the degree of diversification.
Live statistics panel — absorption ratio, cumulative (PC1+PC2), eigenvalues λ₁/λ₂, dispersion, lead asset, and PC1/PC2 scores.
Macro-overlay design — the basket is independent of the chart symbol, so you can overlay market-wide stress on any chart you view. Confirmed-bar updates, no look-ahead.
🧠 Technical Architecture
From 6 asset returns, first and second moments (means, covariances) are updated online with forgetting factor λ, then divided by each asset's standard deviation to build the correlation matrix R (N×N). PC1 is found by power iteration v ← Rv/‖Rv‖, with eigenvalue λ₁ from the Rayleigh quotient. Then deflation R₂ = R − λ₁v₁v₁ᵀ is applied, and PC2 obtained by power iteration with Gram-Schmidt orthogonalization. Since the correlation matrix has trace N, the absorption ratio is λ₁/N and the cumulative is (λ₁+λ₂)/N.
Factor scores are computed by projecting the standardized current returns z_i=(r_i−μ_i)/σ_i onto the eigenvectors (PC1 score = Σz_i·v₁_i). Eigenvectors are warm-started from the previous bar for fast convergence and sign stability across bars (PC1 is oriented so Σv₁ > 0). A high absorption ratio means "correlation convergence = single-factor dominance = fragility"; a low one means "dispersion = diversification." All updates occur on confirmed bars.
🎯 Three design choices stand out. First, using the correlation (not covariance) matrix yields a scale-free absorption ratio that isn't dominated by a single high-volatility asset. Second, warm-starting the eigenvectors suppresses sign flips and flicker, giving smooth scores. Third, confining updates to confirmed bars keeps historical values non-repainting.
⚙️ Recommended Settings & Tuning Guide
As a crypto starting point — a basket of the 6 majors (BTC/ETH/SOL/BNB/XRP/ADA), 1D/4H: adaptation λ = 0.97, Calm threshold 0.40, Stress threshold 0.60; crypto-wide risk-on/off separates cleanly. For nimbler anomaly detection: lower λ toward 0.95 to react faster to correlation shifts, and raise the Stress threshold to 0.65 so only genuine convergence triggers, reducing noise.
Per parameter: Adaptation λ is the main knob — near 0.99 correlations are smooth and long-run; near 0.95 they respond quickly to shocks. Calm/Stress thresholds should be tuned to your basket's composition and its typical absorption ratio (closer to uncorrelated → lower λ₁/N; strongly correlated → higher). Comet length / canvas width tune the phase-space display. The basket can be freely swapped for the assets whose correlation you want to track.
💡 How to Use in Practice
The core read is the absorption-ratio regime. When the ratio is low and stable (CALM), the market is diversified and stock-picking tends to work. When it spikes into the Stress zone, correlations have converged into an "everything moves together" fragile state — a cue to reduce concentration as a leading sign of self-reinforcing declines or risk-off. When the phase-space comet stretches strongly in one direction, the market is factor-driven (trending); when it swirls near the center, it's ranging/rotating. The Lead Asset is the one currently driving the whole market.
For multi-timeframe work, read the higher-timeframe absorption ratio for the macro risk backdrop and execute single-name trades on the lower timeframe. Paired with trend and volatility tools, it serves as a top-level risk filter (e.g., avoid fading during stress spikes).
⚠️ Important Notes
This indicator fetches external data (request.security) for 6 symbols. Specifying invalid or illiquid symbols drops their contribution and degrades accuracy — compose the basket from liquid symbols. Nothing displays until warmup completes. Reloading the indicator rebuilds the correlation moments from scratch — learning state is not persisted. The absorption ratio is a proxy for systemic fragility (akin to Kritzman's absorption ratio), not a directional signal by itself. The sign of the PC2 score is arbitrary. The phase-space comet is drawn in the chart's right margin, so display requires right-side space. Power iteration is an approximation of the top two components, and updates occur on confirmed bars only.
🚨 Disclaimer
This indicator is for educational and informational purposes only and does not constitute financial or investment advice. Past performance is not indicative of future results. All trading involves risk. Use it alongside your own thorough testing and sound risk management; all trading decisions remain solely your own responsibility.
AE-PCA extracts the market's eigen-state from the correlation structure of a basket of assets. It builds a rolling correlation matrix online and extracts the leading principal components — PC1 (market factor), PC2 (rotation/dispersion) — via power iteration with deflation. From the eigenvalues it derives the Absorption Ratio (λ₁/N) — the share of basket variance explained by one factor — which reveals, at a glance, the "everything moves together" systemic fragility of the market. The eigenbasis continuously re-orients each bar to the current correlation structure.
🔶 Key Features
Online PCA engine — builds a rolling correlation matrix with forgetting and extracts the top two principal components by power iteration (heavy use of the matrix type).
Absorption Ratio (systemic stress) — λ₁/N quantifies market concentration = fragility; sharp rises capture the "correlation convergence" that precedes crashes.
Self-evolving eigenbasis — eigenvectors are warm-started and re-converged each bar, tracking shifts in correlation smoothly (subspace tracking) with sign continuity preserved.
Phase-space comet — projects the live return vector onto PC1/PC2 and traces the market's path through factor space as a comet trail on a floating canvas to the right of the chart.
Factor loadings — identifies the asset that loads most heavily on PC1 (the one leading the market).
Dispersion gauge — 1 − Absorption Ratio shows the degree of diversification.
Live statistics panel — absorption ratio, cumulative (PC1+PC2), eigenvalues λ₁/λ₂, dispersion, lead asset, and PC1/PC2 scores.
Macro-overlay design — the basket is independent of the chart symbol, so you can overlay market-wide stress on any chart you view. Confirmed-bar updates, no look-ahead.
🧠 Technical Architecture
From 6 asset returns, first and second moments (means, covariances) are updated online with forgetting factor λ, then divided by each asset's standard deviation to build the correlation matrix R (N×N). PC1 is found by power iteration v ← Rv/‖Rv‖, with eigenvalue λ₁ from the Rayleigh quotient. Then deflation R₂ = R − λ₁v₁v₁ᵀ is applied, and PC2 obtained by power iteration with Gram-Schmidt orthogonalization. Since the correlation matrix has trace N, the absorption ratio is λ₁/N and the cumulative is (λ₁+λ₂)/N.
Factor scores are computed by projecting the standardized current returns z_i=(r_i−μ_i)/σ_i onto the eigenvectors (PC1 score = Σz_i·v₁_i). Eigenvectors are warm-started from the previous bar for fast convergence and sign stability across bars (PC1 is oriented so Σv₁ > 0). A high absorption ratio means "correlation convergence = single-factor dominance = fragility"; a low one means "dispersion = diversification." All updates occur on confirmed bars.
🎯 Three design choices stand out. First, using the correlation (not covariance) matrix yields a scale-free absorption ratio that isn't dominated by a single high-volatility asset. Second, warm-starting the eigenvectors suppresses sign flips and flicker, giving smooth scores. Third, confining updates to confirmed bars keeps historical values non-repainting.
⚙️ Recommended Settings & Tuning Guide
As a crypto starting point — a basket of the 6 majors (BTC/ETH/SOL/BNB/XRP/ADA), 1D/4H: adaptation λ = 0.97, Calm threshold 0.40, Stress threshold 0.60; crypto-wide risk-on/off separates cleanly. For nimbler anomaly detection: lower λ toward 0.95 to react faster to correlation shifts, and raise the Stress threshold to 0.65 so only genuine convergence triggers, reducing noise.
Per parameter: Adaptation λ is the main knob — near 0.99 correlations are smooth and long-run; near 0.95 they respond quickly to shocks. Calm/Stress thresholds should be tuned to your basket's composition and its typical absorption ratio (closer to uncorrelated → lower λ₁/N; strongly correlated → higher). Comet length / canvas width tune the phase-space display. The basket can be freely swapped for the assets whose correlation you want to track.
💡 How to Use in Practice
The core read is the absorption-ratio regime. When the ratio is low and stable (CALM), the market is diversified and stock-picking tends to work. When it spikes into the Stress zone, correlations have converged into an "everything moves together" fragile state — a cue to reduce concentration as a leading sign of self-reinforcing declines or risk-off. When the phase-space comet stretches strongly in one direction, the market is factor-driven (trending); when it swirls near the center, it's ranging/rotating. The Lead Asset is the one currently driving the whole market.
For multi-timeframe work, read the higher-timeframe absorption ratio for the macro risk backdrop and execute single-name trades on the lower timeframe. Paired with trend and volatility tools, it serves as a top-level risk filter (e.g., avoid fading during stress spikes).
⚠️ Important Notes
This indicator fetches external data (request.security) for 6 symbols. Specifying invalid or illiquid symbols drops their contribution and degrades accuracy — compose the basket from liquid symbols. Nothing displays until warmup completes. Reloading the indicator rebuilds the correlation moments from scratch — learning state is not persisted. The absorption ratio is a proxy for systemic fragility (akin to Kritzman's absorption ratio), not a directional signal by itself. The sign of the PC2 score is arbitrary. The phase-space comet is drawn in the chart's right margin, so display requires right-side space. Power iteration is an approximation of the top two components, and updates occur on confirmed bars only.
🚨 Disclaimer
This indicator is for educational and informational purposes only and does not constitute financial or investment advice. Past performance is not indicative of future results. All trading involves risk. Use it alongside your own thorough testing and sound risk management; all trading decisions remain solely your own responsibility.
Skrip sumber terbuka
Dalam semangat TradingView sebenar, pencipta skrip ini telah menjadikannya sumber terbuka, jadi pedagang boleh menilai dan mengesahkan kefungsiannya. Terima kasih kepada penulis! Walaupuan anda boleh menggunakan secara percuma, ingat bahawa penerbitan semula kod ini tertakluk kepada Peraturan Dalaman.

Penafian
Maklumat dan penerbitan adalah tidak bertujuan, dan tidak membentuk, nasihat atau cadangan kewangan, pelaburan, dagangan atau jenis lain yang diberikan atau disahkan oleh TradingView. Baca lebih dalam Terma Penggunaan.
Skrip sumber terbuka
Dalam semangat TradingView sebenar, pencipta skrip ini telah menjadikannya sumber terbuka, jadi pedagang boleh menilai dan mengesahkan kefungsiannya. Terima kasih kepada penulis! Walaupuan anda boleh menggunakan secara percuma, ingat bahawa penerbitan semula kod ini tertakluk kepada Peraturan Dalaman.
Penafian
Maklumat dan penerbitan adalah tidak bertujuan, dan tidak membentuk, nasihat atau cadangan kewangan, pelaburan, dagangan atau jenis lain yang diberikan atau disahkan oleh TradingView. Baca lebih dalam Terma Penggunaan.