OPEN-SOURCE SCRIPT
Seasonality: U.S. Treasuries [invincible3]
Seasonality: U.S. Treasuries [invincible3]
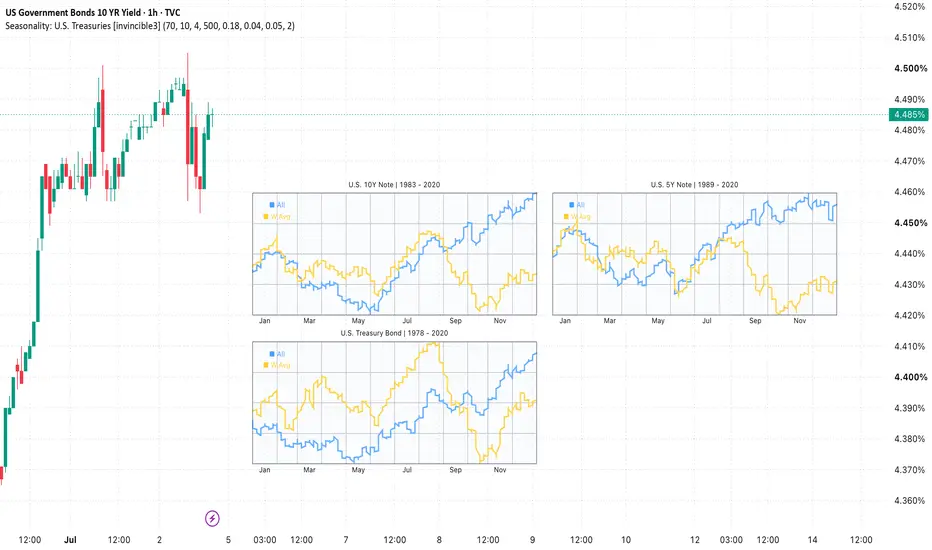
Seasonality: U.S. Treasuries is a visual dashboard-style indicator designed to display historical seasonal tendencies for major U.S. Treasury futures directly on the price chart.
The indicator includes three separate seasonal mini-charts:
Each panel shows a full 365-day seasonal curve, allowing traders to observe how these Treasury instruments have historically behaved throughout the calendar year. The indicator plots both the long-term **All Years average** and a **Weighted Average** curve, making it easier to compare broad historical behavior with a more weighted seasonal tendency.
The dashboard is built to be clean, compact, and flexible. Users can adjust the widget width, distance from candles, panel height, row spacing, column gap, and placement on either the right or left side of the chart. This helps keep the seasonal panels separated from price action while still making the seasonal structure easy to read.
Automatic theme detection is included, so the dashboard adapts to both dark and light TradingView chart themes. Users can also manually customize colors for the grid, background, text, All Years line, and Weighted Average line.
This indicator is useful for traders, analysts, and macro-market observers who want to study historical seasonal patterns in U.S. Treasury markets and compare current market behavior with long-term seasonal tendencies.
Key Features:
This indicator is intended for educational and analytical purposes only. It does not provide financial advice, investment recommendations, or direct buy/sell signals. Seasonal tendencies are based on historical data and do not guarantee future market performance.
Seasonality: U.S. Treasuries is a visual dashboard-style indicator designed to display historical seasonal tendencies for major U.S. Treasury futures directly on the price chart.
The indicator includes three separate seasonal mini-charts:
- U.S. 10-Year Treasury Note — seasonal data from 1983 to 2020
- U.S. 5-Year Treasury Note — seasonal data from 1989 to 2020
- U.S. Treasury Bond — seasonal data from 1978 to 2020
Each panel shows a full 365-day seasonal curve, allowing traders to observe how these Treasury instruments have historically behaved throughout the calendar year. The indicator plots both the long-term **All Years average** and a **Weighted Average** curve, making it easier to compare broad historical behavior with a more weighted seasonal tendency.
The dashboard is built to be clean, compact, and flexible. Users can adjust the widget width, distance from candles, panel height, row spacing, column gap, and placement on either the right or left side of the chart. This helps keep the seasonal panels separated from price action while still making the seasonal structure easy to read.
Automatic theme detection is included, so the dashboard adapts to both dark and light TradingView chart themes. Users can also manually customize colors for the grid, background, text, All Years line, and Weighted Average line.
This indicator is useful for traders, analysts, and macro-market observers who want to study historical seasonal patterns in U.S. Treasury markets and compare current market behavior with long-term seasonal tendencies.
Key Features:
- Seasonal mini-dashboard for U.S. Treasury markets
- Includes 10Y Note, 5Y Note, and Treasury Bond
- 365-day seasonal curves
- All Years average line
- Weighted Average line
- Adjustable widget size and placement
- Clean layout placed away from candles
- Auto dark/light theme support
- Manual color customization
- Designed for visual seasonal analysis
This indicator is intended for educational and analytical purposes only. It does not provide financial advice, investment recommendations, or direct buy/sell signals. Seasonal tendencies are based on historical data and do not guarantee future market performance.
Skrip sumber terbuka
Dalam semangat TradingView sebenar, pencipta skrip ini telah menjadikannya sumber terbuka, jadi pedagang boleh menilai dan mengesahkan kefungsiannya. Terima kasih kepada penulis! Walaupuan anda boleh menggunakan secara percuma, ingat bahawa penerbitan semula kod ini tertakluk kepada Peraturan Dalaman.

Penafian
Maklumat dan penerbitan adalah tidak bertujuan, dan tidak membentuk, nasihat atau cadangan kewangan, pelaburan, dagangan atau jenis lain yang diberikan atau disahkan oleh TradingView. Baca lebih dalam Terma Penggunaan.
Skrip sumber terbuka
Dalam semangat TradingView sebenar, pencipta skrip ini telah menjadikannya sumber terbuka, jadi pedagang boleh menilai dan mengesahkan kefungsiannya. Terima kasih kepada penulis! Walaupuan anda boleh menggunakan secara percuma, ingat bahawa penerbitan semula kod ini tertakluk kepada Peraturan Dalaman.
Penafian
Maklumat dan penerbitan adalah tidak bertujuan, dan tidak membentuk, nasihat atau cadangan kewangan, pelaburan, dagangan atau jenis lain yang diberikan atau disahkan oleh TradingView. Baca lebih dalam Terma Penggunaan.