OPEN-SOURCE SCRIPT
Telah dikemas kini Close Momentum (Area)
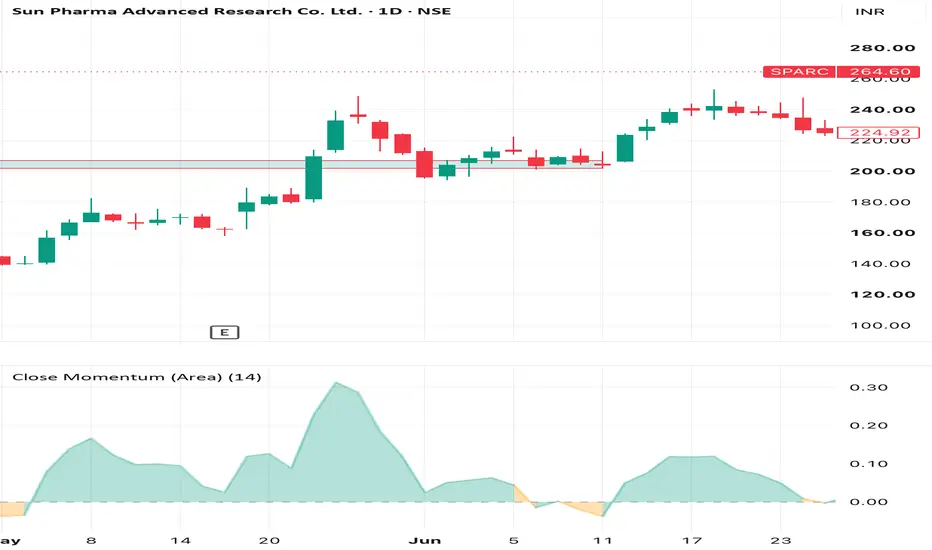
This indicator measures how today’s closing price compares to its own average over a user-defined lookback period (default: ~6 months). It helps you quickly see whether price is trading above or below its medium-term average in a single, easy-to-read pane.
Formula:
Momentum = Close ÷ Average Close (over N days)
• Momentum > 1 → Price is above its N-day average (bullish relative to medium-term mean).
• Momentum = 1 → Price equals its N-day average.
• Momentum < 1 → Price is below its N-day average (bearish relative to medium-term mean).
The result is plotted as a filled area anchored at the 1.0 line, making it easy tospot regimes where price is persistently strong (>1) or weak (<1).
Settings:
• Lookback days for average close – Number of bars used to calculate the average close.
• Default: 126 (≈ 6 months, assuming ~21 trading days/month).
• Adjust for shorter/longer horizons (e.g., 63 for ~3 months, 252 for ~1 year).
How traders can use it:
• Identify trend bias: sustained readings above 1 suggest an uptrend relative to the chosen period; below 1 suggests a downtrend.
• Spot mean-reversion setups: extremes far from 1 may indicate overextended moves.
• Combine with price action or other indicators to filter entries and confirm momentum shifts.
This is a simple, visual way to track medium-term price momentum without cluttering your main chart.
Formula:
Momentum = Close ÷ Average Close (over N days)
• Momentum > 1 → Price is above its N-day average (bullish relative to medium-term mean).
• Momentum = 1 → Price equals its N-day average.
• Momentum < 1 → Price is below its N-day average (bearish relative to medium-term mean).
The result is plotted as a filled area anchored at the 1.0 line, making it easy tospot regimes where price is persistently strong (>1) or weak (<1).
Settings:
• Lookback days for average close – Number of bars used to calculate the average close.
• Default: 126 (≈ 6 months, assuming ~21 trading days/month).
• Adjust for shorter/longer horizons (e.g., 63 for ~3 months, 252 for ~1 year).
How traders can use it:
• Identify trend bias: sustained readings above 1 suggest an uptrend relative to the chosen period; below 1 suggests a downtrend.
• Spot mean-reversion setups: extremes far from 1 may indicate overextended moves.
• Combine with price action or other indicators to filter entries and confirm momentum shifts.
This is a simple, visual way to track medium-term price momentum without cluttering your main chart.
Nota Keluaran
• momentum itself is centered around 1.0, so plotting it with area style makes TradingView fill the space between 1 and the value.• By plotting delta = momentum - 1.0 , the baseline becomes 0, so the filled area is centered properly and no longer occupies the full band from 1 to 0.
Nota Keluaran
changed the nameSkrip sumber terbuka
Dalam semangat TradingView sebenar, pencipta skrip ini telah menjadikannya sumber terbuka, jadi pedagang boleh menilai dan mengesahkan kefungsiannya. Terima kasih kepada penulis! Walaupuan anda boleh menggunakan secara percuma, ingat bahawa penerbitan semula kod ini tertakluk kepada Peraturan Dalaman.

Penafian
Maklumat dan penerbitan adalah tidak bertujuan, dan tidak membentuk, nasihat atau cadangan kewangan, pelaburan, dagangan atau jenis lain yang diberikan atau disahkan oleh TradingView. Baca lebih dalam Terma Penggunaan.
Skrip sumber terbuka
Dalam semangat TradingView sebenar, pencipta skrip ini telah menjadikannya sumber terbuka, jadi pedagang boleh menilai dan mengesahkan kefungsiannya. Terima kasih kepada penulis! Walaupuan anda boleh menggunakan secara percuma, ingat bahawa penerbitan semula kod ini tertakluk kepada Peraturan Dalaman.
Penafian
Maklumat dan penerbitan adalah tidak bertujuan, dan tidak membentuk, nasihat atau cadangan kewangan, pelaburan, dagangan atau jenis lain yang diberikan atau disahkan oleh TradingView. Baca lebih dalam Terma Penggunaan.