OPEN-SOURCE SCRIPT
Connors RSI + Signal
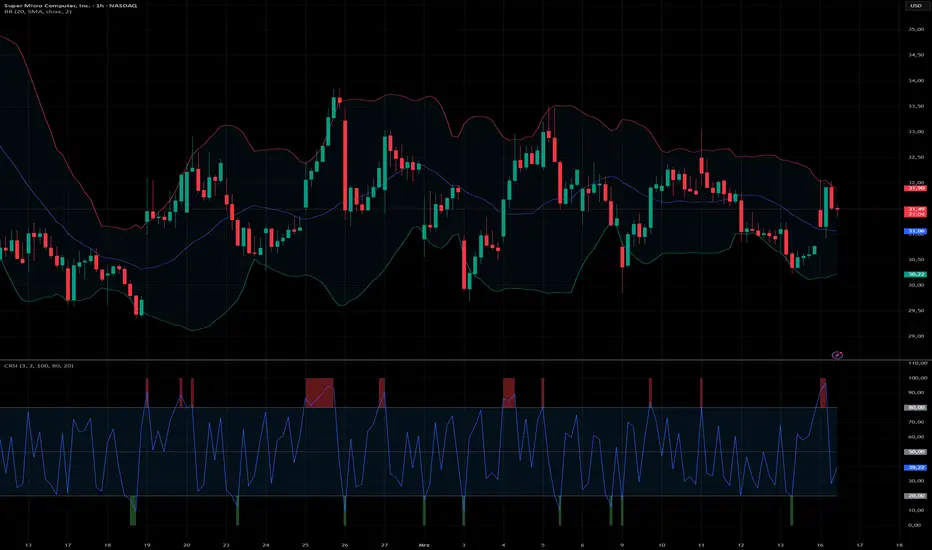
Connors RSI (CRSI) with Dynamic Zone Fills
Overview
This indicator enhances the classic Connors RSI (CRSI) by adding fully customizable, dynamic zone fills for overbought and oversold conditions. It is designed to give you a clear, immediate visual cue when the momentum reaches extreme levels, making it easier to spot potential mean-reversion setups at a glance.
Key Features
Recommended Usage & Pairings
The CRSI is a powerful oscillator for mean-reversion strategies, but it should rarely be used in isolation. For the best results, I highly recommend combining this indicator with price-based channel or volatility indicators:
Disclaimer
Use at your own risk. This script is provided for educational and informational purposes only and does not constitute financial advice. Trading in financial markets involves a high degree of risk and may not be suitable for all investors. Always backtest your strategies and do your own research before committing real capital.
Overview
This indicator enhances the classic Connors RSI (CRSI) by adding fully customizable, dynamic zone fills for overbought and oversold conditions. It is designed to give you a clear, immediate visual cue when the momentum reaches extreme levels, making it easier to spot potential mean-reversion setups at a glance.
Key Features
- Classic CRSI Formula: Combines a standard RSI, an Up/Down streak RSI, and a Rate of Change (ROC) Percent Rank to measure short-term momentum.
- Dynamic Highlighting: The area above the Upper Band and below the Lower Band automatically fills with color as soon as the CRSI crosses into these extreme zones.
- Fully Customizable Bands: You can easily adjust the Upper and Lower Band thresholds in the "Inputs" tab (default is 80 and 20). The background fills will automatically adapt to your custom levels.
Recommended Usage & Pairings
The CRSI is a powerful oscillator for mean-reversion strategies, but it should rarely be used in isolation. For the best results, I highly recommend combining this indicator with price-based channel or volatility indicators:
- Bollinger Bands: Look for confluence. A high-probability setup often occurs when the CRSI highlights an overbought/oversold zone at the same time the price touches or pierces the outer Bollinger Bands.
- Linear Regression Channel: Similar to Bollinger Bands, using a Linear Regression Channel helps you identify price extremes relative to the current trend. A CRSI signal aligning with the upper or lower boundaries of the channel offers a strong context for potential reversals.
Disclaimer
Use at your own risk. This script is provided for educational and informational purposes only and does not constitute financial advice. Trading in financial markets involves a high degree of risk and may not be suitable for all investors. Always backtest your strategies and do your own research before committing real capital.
Skrip sumber terbuka
Dalam semangat TradingView sebenar, pencipta skrip ini telah menjadikannya sumber terbuka, jadi pedagang boleh menilai dan mengesahkan kefungsiannya. Terima kasih kepada penulis! Walaupuan anda boleh menggunakan secara percuma, ingat bahawa penerbitan semula kod ini tertakluk kepada Peraturan Dalaman.

Penafian
Maklumat dan penerbitan adalah tidak bertujuan, dan tidak membentuk, nasihat atau cadangan kewangan, pelaburan, dagangan atau jenis lain yang diberikan atau disahkan oleh TradingView. Baca lebih dalam Terma Penggunaan.
Skrip sumber terbuka
Dalam semangat TradingView sebenar, pencipta skrip ini telah menjadikannya sumber terbuka, jadi pedagang boleh menilai dan mengesahkan kefungsiannya. Terima kasih kepada penulis! Walaupuan anda boleh menggunakan secara percuma, ingat bahawa penerbitan semula kod ini tertakluk kepada Peraturan Dalaman.
Penafian
Maklumat dan penerbitan adalah tidak bertujuan, dan tidak membentuk, nasihat atau cadangan kewangan, pelaburan, dagangan atau jenis lain yang diberikan atau disahkan oleh TradingView. Baca lebih dalam Terma Penggunaan.