OPEN-SOURCE SCRIPT
Sphinx Ledger - Intrabar Volume Profile with Delta Split
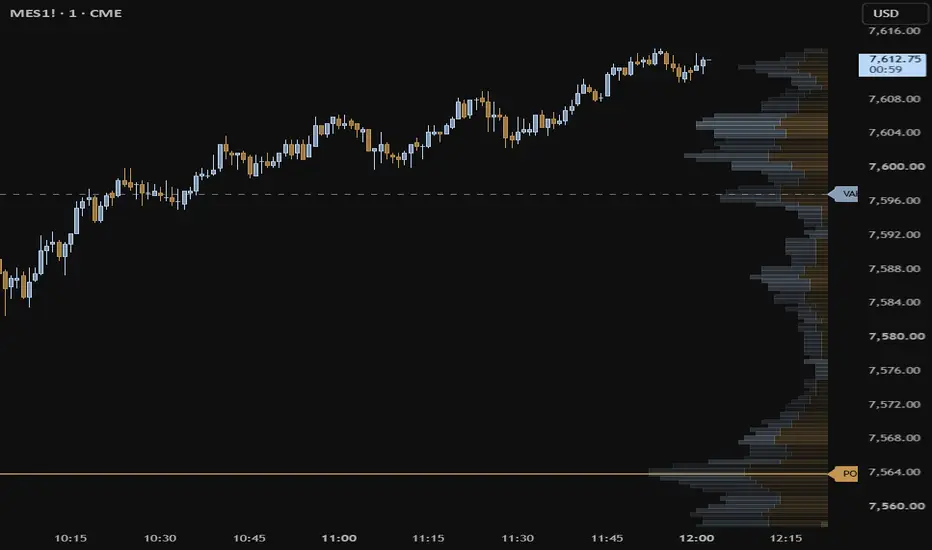
SPHINX LEDGER - Intrabar Volume Profile with Slice-Level Delta
OVERVIEW
Sphinx Ledger is a volume profile that is built from intrabar data instead of chart bars, and that can be anchored either to the trading session or to a rolling multi-day window. It renders a right-edge histogram, a developing POC, a Value Area, and an optional faded backdrop of prior sessions, with every profile row split into its buy and sell components.
The intent is to answer two questions on the same chart: where has volume actually built up, and who was in control at each of those prices.
WHAT IT DOES DIFFERENTLY
Most Pine volume profiles distribute each chart bar's volume evenly across that bar's entire high-low range. On a 1m bar that is a coarse approximation: a bar with a 12 point range smears its volume across all 12 points even if almost all of it traded in a 2 point pocket. High volume shelves get blurred and low volume vacuums get filled in.
Sphinx Ledger instead pulls the intrabar slices inside each chart bar (5 second by default) and bins each slice against its own tight range. Roughly twelve placements per 1m bar rather than one. HVN shelves and LVN gaps resolve much closer to what a native session volume profile shows.
The same slice structure drives the delta split. Each 5 second slice carries its own direction from its own open and close, so the buy/sell proportion inside a row reflects intrabar order flow rather than assigning one direction to a whole 1m bar. A 1m bar that opens low, runs up and closes flat contributes both sides in the correct places instead of registering as a single doji.
HOW THE PROFILE IS CALCULATED
1. Anchor. In Session mode the profile clears at the 20:00 ET reset and rebuilds through the day. In Rolling mode it never clears; each confirmed chart bar is tagged with a day index and entries older than the chosen window are aged out on each new day. Auto mode selects Session below the 1 hour timeframe and Rolling at 1 hour and above.
2. Range and bins. The running high and low of the anchor window are tracked and divided into the configured number of rows. Row height = (window high - window low) / rows.
3. Binning. Each entry (a 5 second slice in Session mode, a chart bar in Rolling mode) is assigned to the rows its high-low range spans, and its volume is divided evenly across those rows. Direction is taken from that entry's own close versus open: up adds to the buy array, down adds to the sell array, an unchanged entry splits 50/50.
4. Range expansion. When a new bar extends the window high or low, bin width changes, so the entire retained history is re-binned from scratch. When the range is unchanged, new slices are added incrementally. This keeps the profile exact rather than drifting as the day expands, without rebuilding on every bar.
5. POC. The row holding the most volume. The plotted price is the midpoint of that row.
6. Value Area. Starting from the POC row, the profile expands outward one row at a time, always taking the higher-volume neighbour, until the accumulated volume reaches the configured percentage of total window volume. VAH is the top edge of the highest included row, VAL is the bottom edge of the lowest.
7. Prior sessions. At each Session-mode reset the completed profile is resampled to the overlay resolution and pushed into a rolling buffer of up to ten days, then drawn behind the live histogram with opacity fading by age.
THE DELTA RENDERING
With delta fill on, each row's bar is divided horizontally in proportion to its buy and sell volume, green on the left, red on the right. The split shows who won at that price. The intensity gradient then maps the absolute delta of the row to opacity: lopsided rows render bright, balanced rows render dim. Together the two convey both direction and conviction per price level, which a single-colour profile cannot.
Reading it in practice:
- A wide row that is heavily one-sided is a shelf that was taken by one side and tends to act as support or resistance on the retest.
- A wide row that is close to balanced is genuine two-sided acceptance, more likely to be chop and a magnet than a turning point.
- A narrow row is a vacuum. Price crossing it usually crosses fast.
- Repeated returns into a one-sided shelf that fail to move it are an absorption read.
SETTINGS
Main
- Timezone: session anchoring reference.
- Profile resolution: number of price bins. Higher gives finer POC precision at more compute cost.
- Profile intrabar resolution: the lower timeframe sampled inside each chart bar. 5S is the default. Falls back to the chart bar automatically if the LTF is not served.
- Value Area percent: standard is 70.
Profile Period
- Anchor mode: Auto, Session (intraday, intrabar slices), or Rolling (HTF composite from chart bars).
- Rolling window days: how many days composite into one profile in Rolling mode. 20 approximates the current swing on a daily chart.
Position
- Histogram right offset and POC/VA line right offset control how far right of the current bar the drawings anchor. Large values need matching right margin in TradingView's chart settings under Scales, Margins, Right.
Histogram
- Show histogram, colour source, opacity, width in bars, optional vertical padding.
- Delta fill, buy and sell colours, delta intensity gradient.
Prior Days
- Overlay on/off, overlay resolution, number of days, colour, newest-day opacity.
POC, Value Area, Labels
- Independent colour, style, width, optional Value Area shading, label size.
HOW TO USE IT
On intraday charts leave the anchor on Auto or set Session. The developing POC is the day's fair value reference: price above it with the POC holding on retests is acceptance higher, price rejecting from below is the opposite. VAH and VAL frame the accepted range, and the first move outside them either accepts and continues or reverts, which is the decision point. LVN gaps between shelves are where fast moves travel.
On 1 hour and above, use Rolling. A single-session profile on a daily chart describes one day and usually plots far from current price, which is not useful. The rolling composite instead describes the current swing, so the POC and Value Area land where price is actually trading.
The prior-day backdrops are for locating shelves that persist across sessions. A level that was an HVN on three consecutive days carries more weight than one that formed this morning.
ALERTS
Six conditions are available, all on the developing values: price crossing above or below POC, VAH, and VAL.
LIMITATIONS AND NOTES
- Volume inside a single slice is distributed evenly across that slice's range. At 5 second resolution the range is small enough that this is close to true placement, but it is still a distribution, not tick-by-tick data.
- Intrabar requests are limited by TradingView on long histories. On charts with a very large number of bars, older bars may not return slices and will fall back to chart-bar placement.
- Sub-minute intrabar data availability depends on your data plan and on the symbol. If 5S is unavailable the script degrades gracefully to the chart bar.
- Pine allows a maximum of 500 boxes. Days shown multiplied by overlay resolution should stay under roughly 450 to leave room for the live histogram, otherwise the oldest backdrops will drop off.
- Prior-day snapshots are captured at the Session-mode day reset. They do not accumulate in Rolling mode.
- On futures, volume comes from the contract being charted. Continuous contracts carry the roll, so profiles spanning a roll date mix contracts.
- The 20:00 ET day reset is the CME session boundary. On non-futures symbols the reset time may not correspond to a meaningful session break.
- This is an analysis tool. It does not generate buy or sell signals and nothing here is financial advice.
OVERVIEW
Sphinx Ledger is a volume profile that is built from intrabar data instead of chart bars, and that can be anchored either to the trading session or to a rolling multi-day window. It renders a right-edge histogram, a developing POC, a Value Area, and an optional faded backdrop of prior sessions, with every profile row split into its buy and sell components.
The intent is to answer two questions on the same chart: where has volume actually built up, and who was in control at each of those prices.
WHAT IT DOES DIFFERENTLY
Most Pine volume profiles distribute each chart bar's volume evenly across that bar's entire high-low range. On a 1m bar that is a coarse approximation: a bar with a 12 point range smears its volume across all 12 points even if almost all of it traded in a 2 point pocket. High volume shelves get blurred and low volume vacuums get filled in.
Sphinx Ledger instead pulls the intrabar slices inside each chart bar (5 second by default) and bins each slice against its own tight range. Roughly twelve placements per 1m bar rather than one. HVN shelves and LVN gaps resolve much closer to what a native session volume profile shows.
The same slice structure drives the delta split. Each 5 second slice carries its own direction from its own open and close, so the buy/sell proportion inside a row reflects intrabar order flow rather than assigning one direction to a whole 1m bar. A 1m bar that opens low, runs up and closes flat contributes both sides in the correct places instead of registering as a single doji.
HOW THE PROFILE IS CALCULATED
1. Anchor. In Session mode the profile clears at the 20:00 ET reset and rebuilds through the day. In Rolling mode it never clears; each confirmed chart bar is tagged with a day index and entries older than the chosen window are aged out on each new day. Auto mode selects Session below the 1 hour timeframe and Rolling at 1 hour and above.
2. Range and bins. The running high and low of the anchor window are tracked and divided into the configured number of rows. Row height = (window high - window low) / rows.
3. Binning. Each entry (a 5 second slice in Session mode, a chart bar in Rolling mode) is assigned to the rows its high-low range spans, and its volume is divided evenly across those rows. Direction is taken from that entry's own close versus open: up adds to the buy array, down adds to the sell array, an unchanged entry splits 50/50.
4. Range expansion. When a new bar extends the window high or low, bin width changes, so the entire retained history is re-binned from scratch. When the range is unchanged, new slices are added incrementally. This keeps the profile exact rather than drifting as the day expands, without rebuilding on every bar.
5. POC. The row holding the most volume. The plotted price is the midpoint of that row.
6. Value Area. Starting from the POC row, the profile expands outward one row at a time, always taking the higher-volume neighbour, until the accumulated volume reaches the configured percentage of total window volume. VAH is the top edge of the highest included row, VAL is the bottom edge of the lowest.
7. Prior sessions. At each Session-mode reset the completed profile is resampled to the overlay resolution and pushed into a rolling buffer of up to ten days, then drawn behind the live histogram with opacity fading by age.
THE DELTA RENDERING
With delta fill on, each row's bar is divided horizontally in proportion to its buy and sell volume, green on the left, red on the right. The split shows who won at that price. The intensity gradient then maps the absolute delta of the row to opacity: lopsided rows render bright, balanced rows render dim. Together the two convey both direction and conviction per price level, which a single-colour profile cannot.
Reading it in practice:
- A wide row that is heavily one-sided is a shelf that was taken by one side and tends to act as support or resistance on the retest.
- A wide row that is close to balanced is genuine two-sided acceptance, more likely to be chop and a magnet than a turning point.
- A narrow row is a vacuum. Price crossing it usually crosses fast.
- Repeated returns into a one-sided shelf that fail to move it are an absorption read.
SETTINGS
Main
- Timezone: session anchoring reference.
- Profile resolution: number of price bins. Higher gives finer POC precision at more compute cost.
- Profile intrabar resolution: the lower timeframe sampled inside each chart bar. 5S is the default. Falls back to the chart bar automatically if the LTF is not served.
- Value Area percent: standard is 70.
Profile Period
- Anchor mode: Auto, Session (intraday, intrabar slices), or Rolling (HTF composite from chart bars).
- Rolling window days: how many days composite into one profile in Rolling mode. 20 approximates the current swing on a daily chart.
Position
- Histogram right offset and POC/VA line right offset control how far right of the current bar the drawings anchor. Large values need matching right margin in TradingView's chart settings under Scales, Margins, Right.
Histogram
- Show histogram, colour source, opacity, width in bars, optional vertical padding.
- Delta fill, buy and sell colours, delta intensity gradient.
Prior Days
- Overlay on/off, overlay resolution, number of days, colour, newest-day opacity.
POC, Value Area, Labels
- Independent colour, style, width, optional Value Area shading, label size.
HOW TO USE IT
On intraday charts leave the anchor on Auto or set Session. The developing POC is the day's fair value reference: price above it with the POC holding on retests is acceptance higher, price rejecting from below is the opposite. VAH and VAL frame the accepted range, and the first move outside them either accepts and continues or reverts, which is the decision point. LVN gaps between shelves are where fast moves travel.
On 1 hour and above, use Rolling. A single-session profile on a daily chart describes one day and usually plots far from current price, which is not useful. The rolling composite instead describes the current swing, so the POC and Value Area land where price is actually trading.
The prior-day backdrops are for locating shelves that persist across sessions. A level that was an HVN on three consecutive days carries more weight than one that formed this morning.
ALERTS
Six conditions are available, all on the developing values: price crossing above or below POC, VAH, and VAL.
LIMITATIONS AND NOTES
- Volume inside a single slice is distributed evenly across that slice's range. At 5 second resolution the range is small enough that this is close to true placement, but it is still a distribution, not tick-by-tick data.
- Intrabar requests are limited by TradingView on long histories. On charts with a very large number of bars, older bars may not return slices and will fall back to chart-bar placement.
- Sub-minute intrabar data availability depends on your data plan and on the symbol. If 5S is unavailable the script degrades gracefully to the chart bar.
- Pine allows a maximum of 500 boxes. Days shown multiplied by overlay resolution should stay under roughly 450 to leave room for the live histogram, otherwise the oldest backdrops will drop off.
- Prior-day snapshots are captured at the Session-mode day reset. They do not accumulate in Rolling mode.
- On futures, volume comes from the contract being charted. Continuous contracts carry the roll, so profiles spanning a roll date mix contracts.
- The 20:00 ET day reset is the CME session boundary. On non-futures symbols the reset time may not correspond to a meaningful session break.
- This is an analysis tool. It does not generate buy or sell signals and nothing here is financial advice.
Skrip sumber terbuka
Dalam semangat TradingView sebenar, pencipta skrip ini telah menjadikannya sumber terbuka, jadi pedagang boleh menilai dan mengesahkan kefungsiannya. Terima kasih kepada penulis! Walaupuan anda boleh menggunakan secara percuma, ingat bahawa penerbitan semula kod ini tertakluk kepada Peraturan Dalaman.

Hermetic Trader · "What gets measured gets managed."
hermetictrader.com
hermetictrader.com
Penafian
Maklumat dan penerbitan adalah tidak bertujuan, dan tidak membentuk, nasihat atau cadangan kewangan, pelaburan, dagangan atau jenis lain yang diberikan atau disahkan oleh TradingView. Baca lebih dalam Terma Penggunaan.
Skrip sumber terbuka
Dalam semangat TradingView sebenar, pencipta skrip ini telah menjadikannya sumber terbuka, jadi pedagang boleh menilai dan mengesahkan kefungsiannya. Terima kasih kepada penulis! Walaupuan anda boleh menggunakan secara percuma, ingat bahawa penerbitan semula kod ini tertakluk kepada Peraturan Dalaman.
Hermetic Trader · "What gets measured gets managed."
hermetictrader.com
hermetictrader.com
Penafian
Maklumat dan penerbitan adalah tidak bertujuan, dan tidak membentuk, nasihat atau cadangan kewangan, pelaburan, dagangan atau jenis lain yang diberikan atau disahkan oleh TradingView. Baca lebih dalam Terma Penggunaan.