OPEN-SOURCE SCRIPT
Market Structured Trend Ladder
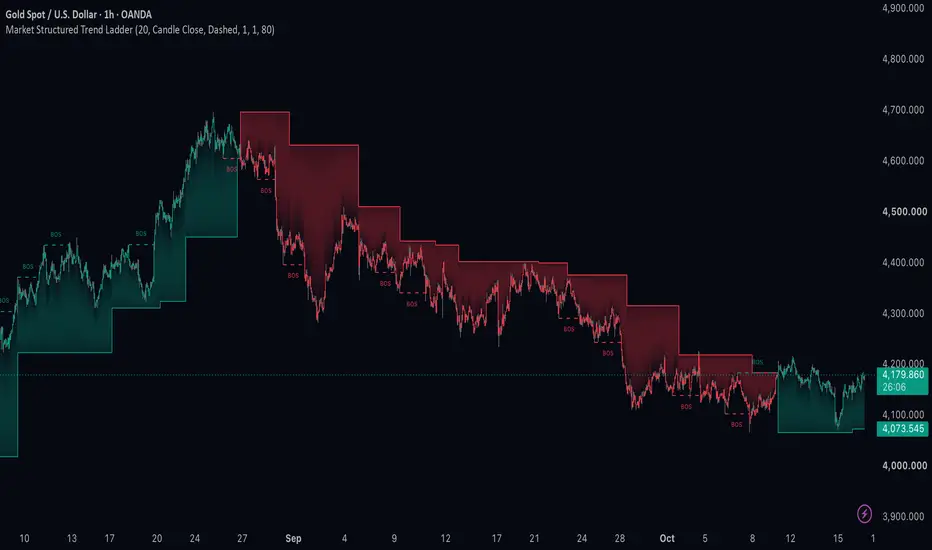
Market Structured Trend Ladder | NeuraAlgo
Overview

Market Structured Trend Ladder is a price-action-based market structure indicator designed to identify Breaks of Structure (BOS), highlight potential Changes of Character (CHoCH), and visualize directional trend bias through a dynamic step-based trend ladder.
The indicator uses confirmed swing highs and swing lows to identify important structural price levels. When price breaks an active swing level, the indicator marks the event, updates its directional bias, and adjusts the trend ladder according to subsequent confirmed swing points.
By combining market structure analysis, configurable breakout confirmation, trend-based candle coloring, and a dynamic ladder with optional chart shading, Market Structured Trend Ladder provides a clear framework for analyzing market direction and structural developments.
Main Features
How It Works
1. Market Structure Detection
The indicator identifies swing highs and swing lows using the selected Swing Length. A pivot is confirmed only after the required number of bars has formed on both sides of the potential swing point.
Confirmed swing levels become active structural references until price breaks through them.
2. Break of Structure (BOS)
A bullish or bearish structural break occurs when the selected price source crosses an active swing level.
The indicator draws a horizontal line at the broken level and adds a corresponding structure label. Each active swing level is marked only once before being deactivated.
3. Change of Character (CHoCH)
When enabled, the indicator labels a breakout as CHoCH when its direction is opposite to the previously recorded breakout direction. Other qualifying structural breaks are labeled BOS.
This distinction helps traders observe potential changes in directional market behavior. CHoCH is based on the indicator's recorded breakout sequence and should not be interpreted as confirmation of a complete trend reversal.
4. Trend Bias and Candle Coloring
The current trend bias updates when a bullish or bearish structural break occurs.
The bias remains active until an opposing structural breakout changes it.
5. Dynamic Trend Ladder
The trend ladder provides a step-based reference that follows the current structural bias.
The ladder is designed to visualize evolving structural reference levels rather than generate independent entry or exit signals.
6. Ladder Fill
Optional chart shading highlights the area between the closing price and the trend ladder. The fill color follows the current trend bias, while the transparency setting controls its visual intensity.
Settings Guide
Suggested Usage
Market Structured Trend Ladder can be used to study structural breakouts, follow changes in directional bias, and observe how confirmed swing levels evolve over time.
Traders may combine BOS and CHoCH labels with the trend ladder, support and resistance zones, liquidity analysis, volume, or higher-timeframe market structure when evaluating potential trading opportunities.
The indicator can be applied across different markets and timeframes, but its behavior will vary according to the selected Swing Length and breakout confirmation method.
Important Considerations
Swing points require subsequent bars for confirmation, so structural levels are identified with a delay. Once confirmed, the indicator uses those levels as active breakout references.
Candle-close confirmation is generally more restrictive than wick-based confirmation. Wick-based confirmation can identify breaks earlier but may also register price movements that do not persist through the candle close.
The CHoCH label reflects the direction of the previous recorded breakout, not a complete independent assessment of market structure. The trend ladder is a structural visualization tool and does not guarantee that its levels will hold as support or resistance.
Disclaimer: Market Structured Trend Ladder is intended for educational and informational purposes only. It does not provide guaranteed trading signals or constitute financial or investment advice. Always apply appropriate risk management and evaluate trading decisions within the broader market context.
© NeuraAlgo | Licensed under the Mozilla Public License 2.0 (MPL-2.0).
Overview
Market Structured Trend Ladder is a price-action-based market structure indicator designed to identify Breaks of Structure (BOS), highlight potential Changes of Character (CHoCH), and visualize directional trend bias through a dynamic step-based trend ladder.
The indicator uses confirmed swing highs and swing lows to identify important structural price levels. When price breaks an active swing level, the indicator marks the event, updates its directional bias, and adjusts the trend ladder according to subsequent confirmed swing points.
By combining market structure analysis, configurable breakout confirmation, trend-based candle coloring, and a dynamic ladder with optional chart shading, Market Structured Trend Ladder provides a clear framework for analyzing market direction and structural developments.
Main Features
- Swing High and Low Detection — Identifies confirmed market swing points using a configurable swing length.
- Break of Structure (BOS) — Marks price breaks above active swing highs or below active swing lows.
- Change of Character (CHoCH) — Optionally labels a structural break in the direction opposite to the previous recorded breakout direction.
- Flexible Breakout Confirmation — Choose between candle-close confirmation and wick-based confirmation.
- Dynamic Trend Ladder — Displays a step-based reference level that updates according to the current trend bias and newly confirmed swing points.
- Trend-Based Candle Coloring — Colors candles according to the latest bullish or bearish structural breakout.
- Customizable Structure Lines — Adjust line style, thickness, and bullish or bearish colors.
- Adjustable Ladder Display — Enable or disable the trend ladder and customize its width and fill transparency.
- Market Structure Visualization — Combines breakout levels, event labels, candle colors, and ladder shading in a unified chart display.
How It Works
1. Market Structure Detection
The indicator identifies swing highs and swing lows using the selected Swing Length. A pivot is confirmed only after the required number of bars has formed on both sides of the potential swing point.
Confirmed swing levels become active structural references until price breaks through them.
2. Break of Structure (BOS)
A bullish or bearish structural break occurs when the selected price source crosses an active swing level.
- Bullish BOS: Price moves above the previous active swing high.
- Bearish BOS: Price moves below the previous active swing low.
The indicator draws a horizontal line at the broken level and adds a corresponding structure label. Each active swing level is marked only once before being deactivated.
3. Change of Character (CHoCH)
When enabled, the indicator labels a breakout as CHoCH when its direction is opposite to the previously recorded breakout direction. Other qualifying structural breaks are labeled BOS.
This distinction helps traders observe potential changes in directional market behavior. CHoCH is based on the indicator's recorded breakout sequence and should not be interpreted as confirmation of a complete trend reversal.
4. Trend Bias and Candle Coloring
The current trend bias updates when a bullish or bearish structural break occurs.
- Bullish Bias: A bullish breakout establishes bullish trend coloring.
- Bearish Bias: A bearish breakout establishes bearish trend coloring.
- Initial State: Before the first qualifying breakout, candles retain their chart-default colors.
The bias remains active until an opposing structural breakout changes it.
5. Dynamic Trend Ladder
The trend ladder provides a step-based reference that follows the current structural bias.
- Bullish Ladder: Begins at the most recently stored swing low when bullish bias is established. It can step upward as new confirmed swing lows form.
- Bearish Ladder: Begins at the most recently stored swing high when bearish bias is established. It can step downward as new confirmed swing highs form.
The ladder is designed to visualize evolving structural reference levels rather than generate independent entry or exit signals.
6. Ladder Fill
Optional chart shading highlights the area between the closing price and the trend ladder. The fill color follows the current trend bias, while the transparency setting controls its visual intensity.
Settings Guide
- Swing Length: Determines the number of bars required on both sides to confirm a swing point. Higher values generally produce fewer, more widely spaced structural levels.
- BOS Confirmation: Select Candle Close to require a closing-price break, or Wicks to use the high or low crossing the active swing level.
- Show CHoCH: Enables labels for breakouts opposite to the previously recorded breakout direction.
- Line Style: Select Solid, Dashed, or Dotted structure lines.
- Line Width: Controls the thickness of BOS and CHoCH level lines.
- Bullish Color: Sets the color for bullish structure breaks, bullish trend candles, and the bullish ladder.
- Bearish Color: Sets the color for bearish structure breaks, bearish trend candles, and the bearish ladder.
- Show Trend Ladder: Toggles the ladder display and its associated fill.
- Ladder Width: Adjusts the thickness of the step-based trend line.
- Fill Transparency: Controls the transparency of the area between price and the ladder.
Suggested Usage
Market Structured Trend Ladder can be used to study structural breakouts, follow changes in directional bias, and observe how confirmed swing levels evolve over time.
Traders may combine BOS and CHoCH labels with the trend ladder, support and resistance zones, liquidity analysis, volume, or higher-timeframe market structure when evaluating potential trading opportunities.
The indicator can be applied across different markets and timeframes, but its behavior will vary according to the selected Swing Length and breakout confirmation method.
Important Considerations
Swing points require subsequent bars for confirmation, so structural levels are identified with a delay. Once confirmed, the indicator uses those levels as active breakout references.
Candle-close confirmation is generally more restrictive than wick-based confirmation. Wick-based confirmation can identify breaks earlier but may also register price movements that do not persist through the candle close.
The CHoCH label reflects the direction of the previous recorded breakout, not a complete independent assessment of market structure. The trend ladder is a structural visualization tool and does not guarantee that its levels will hold as support or resistance.
Disclaimer: Market Structured Trend Ladder is intended for educational and informational purposes only. It does not provide guaranteed trading signals or constitute financial or investment advice. Always apply appropriate risk management and evaluate trading decisions within the broader market context.
© NeuraAlgo | Licensed under the Mozilla Public License 2.0 (MPL-2.0).
Skrip sumber terbuka
Dalam semangat TradingView sebenar, pencipta skrip ini telah menjadikannya sumber terbuka, jadi pedagang boleh menilai dan mengesahkan kefungsiannya. Terima kasih kepada penulis! Walaupuan anda boleh menggunakan secara percuma, ingat bahawa penerbitan semula kod ini tertakluk kepada Peraturan Dalaman.

Penafian
Maklumat dan penerbitan adalah tidak bertujuan, dan tidak membentuk, nasihat atau cadangan kewangan, pelaburan, dagangan atau jenis lain yang diberikan atau disahkan oleh TradingView. Baca lebih dalam Terma Penggunaan.
Skrip sumber terbuka
Dalam semangat TradingView sebenar, pencipta skrip ini telah menjadikannya sumber terbuka, jadi pedagang boleh menilai dan mengesahkan kefungsiannya. Terima kasih kepada penulis! Walaupuan anda boleh menggunakan secara percuma, ingat bahawa penerbitan semula kod ini tertakluk kepada Peraturan Dalaman.
Penafian
Maklumat dan penerbitan adalah tidak bertujuan, dan tidak membentuk, nasihat atau cadangan kewangan, pelaburan, dagangan atau jenis lain yang diberikan atau disahkan oleh TradingView. Baca lebih dalam Terma Penggunaan.