OPEN-SOURCE SCRIPT
Weekly/Daily Levels & 30m Supply/Demand
Here is a concise and professional description you can use to publish your indicator on TradingView:
**Daily and Weekly Levels & 30m Supply/Demand**
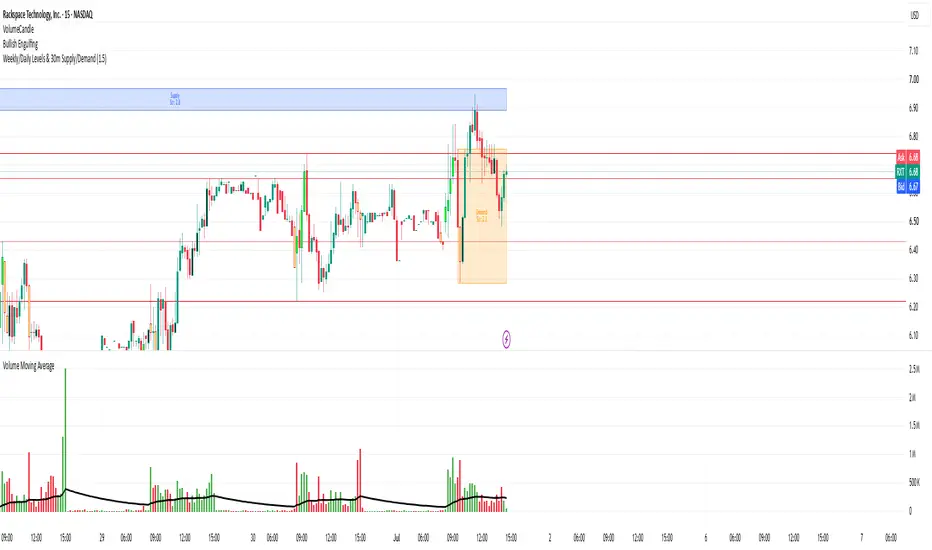
This indicator provides a clean, automated map of key higher timeframe liquidity levels and short-term supply/demand zones without cluttering your chart.
**Key Features:**
* **Static Daily and Weekly Liquidity Levels:** Automatically plots straight, extended horizontal lines for the Previous Week's High/Low (Aqua) and the Previous 3 Days' Highs/Lows (shades of Red). These lines remain static regardless of your current chart timeframe.
* **30-Minute S/D Zones:** Independently analyzes 30-minute price action in the background to detect powerful market imbalances. It identifies "base" candles followed by explosive moves (measured via ATR) to draw Supply (Blue) and Demand (Orange) zones.
* **Strength Labels & Filtering:** Each zone displays a "Strength" multiplier based on the size of the explosive move. The script intelligently filters out overlapping zones to keep the chart clean.
* **Dynamic Mitigation:** Zones are continuously monitored and automatically deleted from the chart once price breaks and closes beyond them, ensuring you are only looking at fresh, unbroken levels.
**Usage:**
Perfect for day traders and swing traders who want to combine macro daily/weekly liquidity targets with precise 30m entry/exit zones. Adjust the "Explosive Move ATR Multiplier" in the settings to filter for stronger or weaker zone creations.
**Daily and Weekly Levels & 30m Supply/Demand**
This indicator provides a clean, automated map of key higher timeframe liquidity levels and short-term supply/demand zones without cluttering your chart.
**Key Features:**
* **Static Daily and Weekly Liquidity Levels:** Automatically plots straight, extended horizontal lines for the Previous Week's High/Low (Aqua) and the Previous 3 Days' Highs/Lows (shades of Red). These lines remain static regardless of your current chart timeframe.
* **30-Minute S/D Zones:** Independently analyzes 30-minute price action in the background to detect powerful market imbalances. It identifies "base" candles followed by explosive moves (measured via ATR) to draw Supply (Blue) and Demand (Orange) zones.
* **Strength Labels & Filtering:** Each zone displays a "Strength" multiplier based on the size of the explosive move. The script intelligently filters out overlapping zones to keep the chart clean.
* **Dynamic Mitigation:** Zones are continuously monitored and automatically deleted from the chart once price breaks and closes beyond them, ensuring you are only looking at fresh, unbroken levels.
**Usage:**
Perfect for day traders and swing traders who want to combine macro daily/weekly liquidity targets with precise 30m entry/exit zones. Adjust the "Explosive Move ATR Multiplier" in the settings to filter for stronger or weaker zone creations.
Skrip sumber terbuka
Dalam semangat TradingView sebenar, pencipta skrip ini telah menjadikannya sumber terbuka, jadi pedagang boleh menilai dan mengesahkan kefungsiannya. Terima kasih kepada penulis! Walaupuan anda boleh menggunakan secara percuma, ingat bahawa penerbitan semula kod ini tertakluk kepada Peraturan Dalaman.

Penafian
Maklumat dan penerbitan adalah tidak bertujuan, dan tidak membentuk, nasihat atau cadangan kewangan, pelaburan, dagangan atau jenis lain yang diberikan atau disahkan oleh TradingView. Baca lebih dalam Terma Penggunaan.
Skrip sumber terbuka
Dalam semangat TradingView sebenar, pencipta skrip ini telah menjadikannya sumber terbuka, jadi pedagang boleh menilai dan mengesahkan kefungsiannya. Terima kasih kepada penulis! Walaupuan anda boleh menggunakan secara percuma, ingat bahawa penerbitan semula kod ini tertakluk kepada Peraturan Dalaman.
Penafian
Maklumat dan penerbitan adalah tidak bertujuan, dan tidak membentuk, nasihat atau cadangan kewangan, pelaburan, dagangan atau jenis lain yang diberikan atau disahkan oleh TradingView. Baca lebih dalam Terma Penggunaan.