KAMA Adaptive RSI [NJ]
✧ OVERVIEW ✧
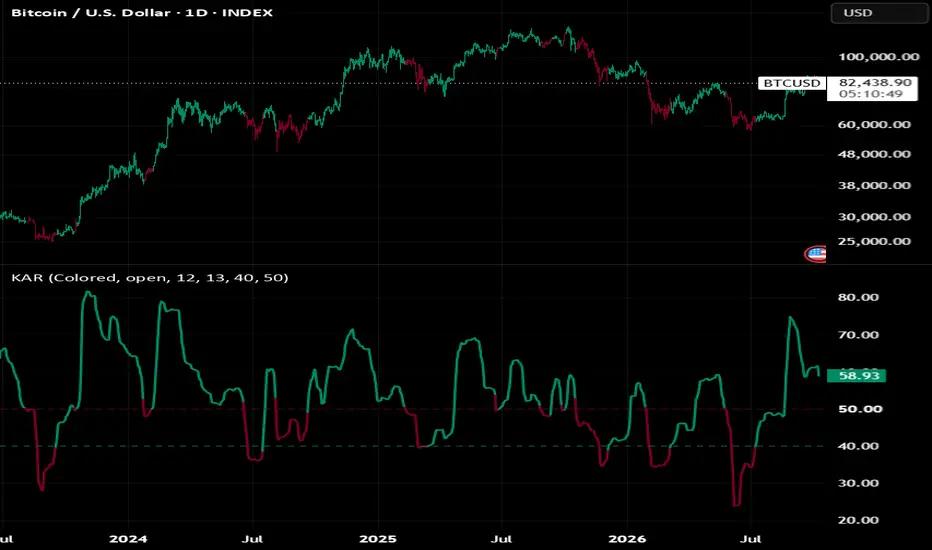
KAMA Adaptive RSI is a momentum-based, trend-following oscillator that smooths the Relative Strength Index with Kaufman's Adaptive Moving Average.
KAMA adjusts its smoothing speed based on how efficiently RSI is moving. It follows RSI closely during steady directional moves and slows down when RSI moves back and forth without clear direction.
Smoothed RSI crossing the long and short thresholds is used to identify bullish and bearish conditions

✧ SETTINGS ✧
Color Mode
Switches between colored and neutral visualization.
Color Candles
Shows or hides candle coloring based on the current signal.
RSI Source
Selects the price source used for the RSI calculation.
RSI Length
Controls how many bars are used to calculate the RSI.
Smoothing Length
Controls how many bars are used to measure efficiency for the KAMA smoothing.
Long Threshold
Controls the first RSI level used for signal changes.
Short Threshold
Controls the second RSI level used for signal changes.
✧ HOW IT WORKS ✧
Relative Strength Index
RSI compares recent gains and losses of selected source and expresses the result on a scale from 0 to 100.
Values above 50 indicate stronger upward movement, while values below 50 indicate stronger downward movement.
Efficiency Ratio
Indicator measures how directly RSI has moved over Smoothing Length.
Efficiency Ratio = Net RSI Change / Sum of All Bar-to-Bar RSI Changes
Values near 1 indicate that RSI is moving steadily in one direction. Values near 0 indicate that RSI is moving back and forth without much net progress.
Kaufman's Adaptive Moving Average
Efficiency Ratio is converted into a smoothing constant that ranges between the speed of a 2-period and a 30-period EMA.
Smoothed RSI = Previous Value + Smoothing Constant × (RSI − Previous Value)
High efficiency moves the smoothed line quickly toward RSI. Low efficiency keeps it close to its previous value, filtering short-term noise.
Signal Logic
A bullish condition is activated when smoothed RSI crosses above either threshold.
A bearish condition is activated when smoothed RSI crosses below either threshold.
Because both levels can trigger a change, the condition switches at the first threshold crossed in each direction.
Active condition remains unchanged until the opposite condition occurs.
✧ VISUALIZATION ✧
Oscillator changes color based on the active condition:
Green represents a bullish condition.
Red represents a bearish condition.
Neutral mode displays the same conditions using light and dark shades.
Long and short thresholds are plotted as dashed lines in bullish and bearish colors.
Same signal colors can optionally be applied directly to the chart candles.
✧ USAGE ✧
KAMA Adaptive RSI can be used to identify:
Bullish and bearish momentum conditions
Shifts in directional strength
Potential trend changes
Trend confirmation
Market bias
Additional confirmation for other technical analysis
Adaptive smoothing is designed to keep the oscillator responsive during clear momentum moves while reducing signal changes caused by choppy RSI movement.
As with any technical indicator, it is best used alongside other forms of analysis rather than as a standalone entry or exit signal.
KAMA Adaptive RSI is a momentum-based, trend-following oscillator that smooths the Relative Strength Index with Kaufman's Adaptive Moving Average.
KAMA adjusts its smoothing speed based on how efficiently RSI is moving. It follows RSI closely during steady directional moves and slows down when RSI moves back and forth without clear direction.
Smoothed RSI crossing the long and short thresholds is used to identify bullish and bearish conditions
✧ SETTINGS ✧
Color Mode
Switches between colored and neutral visualization.
Color Candles
Shows or hides candle coloring based on the current signal.
RSI Source
Selects the price source used for the RSI calculation.
RSI Length
Controls how many bars are used to calculate the RSI.
Smoothing Length
Controls how many bars are used to measure efficiency for the KAMA smoothing.
Long Threshold
Controls the first RSI level used for signal changes.
Short Threshold
Controls the second RSI level used for signal changes.
✧ HOW IT WORKS ✧
Relative Strength Index
RSI compares recent gains and losses of selected source and expresses the result on a scale from 0 to 100.
Values above 50 indicate stronger upward movement, while values below 50 indicate stronger downward movement.
Efficiency Ratio
Indicator measures how directly RSI has moved over Smoothing Length.
Efficiency Ratio = Net RSI Change / Sum of All Bar-to-Bar RSI Changes
Values near 1 indicate that RSI is moving steadily in one direction. Values near 0 indicate that RSI is moving back and forth without much net progress.
Kaufman's Adaptive Moving Average
Efficiency Ratio is converted into a smoothing constant that ranges between the speed of a 2-period and a 30-period EMA.
Smoothed RSI = Previous Value + Smoothing Constant × (RSI − Previous Value)
High efficiency moves the smoothed line quickly toward RSI. Low efficiency keeps it close to its previous value, filtering short-term noise.
Signal Logic
A bullish condition is activated when smoothed RSI crosses above either threshold.
A bearish condition is activated when smoothed RSI crosses below either threshold.
Because both levels can trigger a change, the condition switches at the first threshold crossed in each direction.
Active condition remains unchanged until the opposite condition occurs.
✧ VISUALIZATION ✧
Oscillator changes color based on the active condition:
Green represents a bullish condition.
Red represents a bearish condition.
Neutral mode displays the same conditions using light and dark shades.
Long and short thresholds are plotted as dashed lines in bullish and bearish colors.
Same signal colors can optionally be applied directly to the chart candles.
✧ USAGE ✧
KAMA Adaptive RSI can be used to identify:
Bullish and bearish momentum conditions
Shifts in directional strength
Potential trend changes
Trend confirmation
Market bias
Additional confirmation for other technical analysis
Adaptive smoothing is designed to keep the oscillator responsive during clear momentum moves while reducing signal changes caused by choppy RSI movement.
As with any technical indicator, it is best used alongside other forms of analysis rather than as a standalone entry or exit signal.

Penafian
Maklumat dan penerbitan adalah tidak bertujuan, dan tidak membentuk, nasihat atau cadangan kewangan, pelaburan, dagangan atau jenis lain yang diberikan atau disahkan oleh TradingView. Baca lebih dalam Terma Penggunaan.
Penafian
Maklumat dan penerbitan adalah tidak bertujuan, dan tidak membentuk, nasihat atau cadangan kewangan, pelaburan, dagangan atau jenis lain yang diberikan atau disahkan oleh TradingView. Baca lebih dalam Terma Penggunaan.