Telah dikemas kini
AG Pro Consolidation Breakout Quality [AGPro Series]
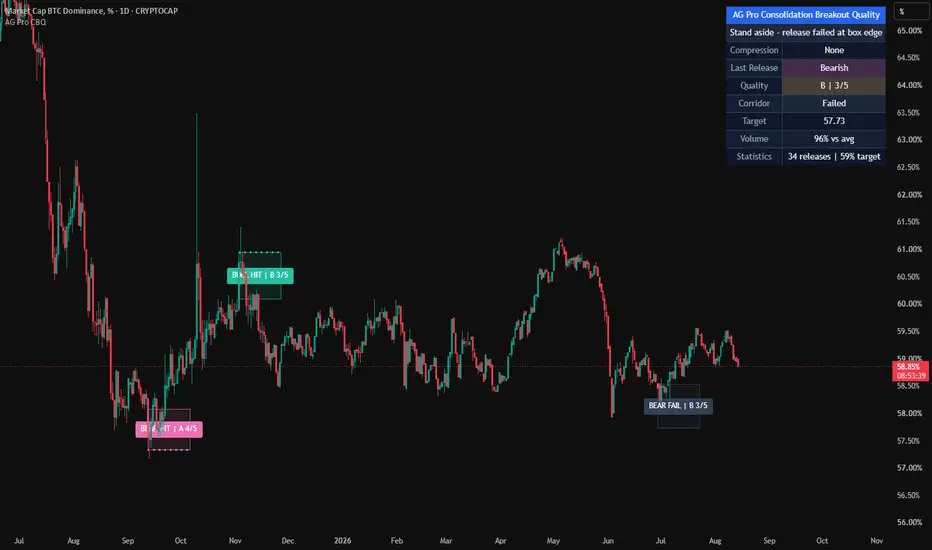
AG Pro Consolidation Breakout Quality [AGPro Series]
Overview / What it does
AG Pro Consolidation Breakout Quality is an overlay tool designed to detect compression zones and evaluate the quality of the breakout that emerges from them. Instead of marking every simple range expansion, the script first looks for a valid consolidation structure, then measures how convincing the breakout is once price closes outside the box.
The core idea is straightforward: not every breakout from a tight range carries the same informational value. Some breaks occur with weak commitment, low participation, and immediate failure. Others show stronger intent through better candle structure, stronger relative volume, longer pre-break compression, and cleaner continuation behavior. This script is built to separate those conditions visually and systematically.
The indicator automatically identifies consolidation zones using a narrow-range logic relative to ATR. When a valid box forms, the structure is drawn on the chart. If price closes beyond the upper or lower edge of that box, the script registers a breakout or breakdown and assigns a quality score. A throwback event can also be tracked after the break, helping users distinguish cleaner expansions from breaks that immediately revisit the zone.
This makes the script useful for traders who want to monitor compression-to-expansion behavior in a structured way. It can be used to review developing ranges, compare breakout quality across instruments, and filter visual attention toward stronger or weaker breakout events without turning the chart into a cluttered signal feed.
Unique Edge
The differentiating idea behind this tool is that it does not treat consolidation and breakout as two unrelated events. It treats them as one sequence: compression, release, validation, and possible throwback. That sequence is then scored.
Many breakout tools only draw a box or mark the first candle that moves outside a recent range. This script adds a second layer by evaluating the break itself. Volume participation, the strength of the closing position, the duration of the consolidation, and the efficiency of the breakout candle all contribute to the final quality read. If price quickly throws back into the prior box, that weakness is also reflected.
This makes the script a natural sibling to AG Pro Break-Retest Quality, but it is not a duplicate. Break-Retest Quality focuses on retest behavior after a level break. Consolidation Breakout Quality begins one step earlier by focusing on the compression box itself, the first breakout from that structure, and the immediate integrity of that release. The emphasis here is the quality of expansion from consolidation, not the later retest workflow.
Methodology
1) Consolidation detection
The script scans for a sequence of relatively narrow bars. Narrowness is measured against ATR, so the detection logic adapts to the volatility environment of the symbol rather than relying on a fixed tick or percentage threshold. Once the required number of bars is reached, a consolidation box is formed from the local high-low range of that sequence.
2) Breakout / breakdown detection
A bullish breakout is registered when price closes above the upper boundary of the active consolidation box. A bearish breakdown is registered when price closes below the lower boundary. The breakout level is then projected forward visually so the user can continue tracking the structure after the event.
3) Quality scoring
The script assigns a 1 to 5 quality score using a weighted ruleset built around the breakout event:
- Base breakout occurrence
- Relative volume expansion compared with a volume moving average
- Strength of the close beyond the box boundary
- Duration of the consolidation before release
- Body efficiency of the breakout candle
4) Throwback context
After the breakout, the script can monitor whether price returns back into the broken consolidation box within a user-defined lookback window. This is treated as a sign of weaker follow-through and can be displayed directly on the chart for fast context reading.
5) Visual workflow
The chart uses a structured visual hierarchy:
- Consolidation box
- Breakout or breakdown label
- Throwback warning label
- Quality score card
- Breakout level projection
- Compact info panel
The goal is to keep the workflow readable while preserving enough structure for live chart use.
Signals & Alerts
The script can generate alerts for:
- Bullish breakout
- Bearish breakdown
- High-quality breakout conditions
- Elite-quality breakout conditions
- Throwback warning
- Any breakout event
This allows the tool to be used either as a visual chart companion or as part of a broader alert-driven workflow. Users who prefer stricter confirmation logic should configure alerts in a way that matches their execution style.
Key Inputs
Consolidation Settings
- Consolidation Length: number of bars required to form a valid consolidation
- ATR Multiplier: sensitivity threshold for narrow-range detection
- ATR Length: volatility lookback
- Max Zones to Display: keeps chart objects under control
Quality Scoring
- Volume Spike toggle
- Volume MA Length
- Volume Spike Multiplier
- Close Position scoring toggle
- Throwback monitoring toggle
- Throwback lookback length
Visual Settings
- Box color
- Bullish breakout color
- Bearish breakdown color
- Throwback color
- Box, level, score, arrow, and panel visibility
- Label size controls
Alerts
- Minimum score threshold for alert relevance
Limitations & Transparency
This script is a market-structure visualization and event-quality tool. It is not a prediction engine, and it does not claim that every high score will lead to continuation or that every low score will fail. The score is a structured summary of selected breakout characteristics, not a guarantee of outcome.
Consolidation detection depends on the selected ATR settings and bar count. Different symbols, sessions, and timeframes may require different parameter values. Users should expect the frequency and strictness of the boxes to change when those settings are adjusted.
Volume-based logic may be more informative on instruments and venues where reported volume is meaningful. On some markets, volume behavior can be less consistent, which may reduce the usefulness of the volume component.
Throwback detection is intended as context, not as a complete post-break trade management model. A throwback can represent weakness, but in some workflows it may also represent a later confirmation opportunity. The script leaves that interpretation to the user.
Risk Disclosure
This indicator is for chart analysis, structure review, and breakout context evaluation only. It does not provide financial advice, investment recommendations, or guaranteed trade outcomes. All trading and investing involve risk, including the risk of loss. Users should evaluate the tool on their own symbols, timeframes, and execution rules before relying on it in live decision-making.
Overview / What it does
AG Pro Consolidation Breakout Quality is an overlay tool designed to detect compression zones and evaluate the quality of the breakout that emerges from them. Instead of marking every simple range expansion, the script first looks for a valid consolidation structure, then measures how convincing the breakout is once price closes outside the box.
The core idea is straightforward: not every breakout from a tight range carries the same informational value. Some breaks occur with weak commitment, low participation, and immediate failure. Others show stronger intent through better candle structure, stronger relative volume, longer pre-break compression, and cleaner continuation behavior. This script is built to separate those conditions visually and systematically.
The indicator automatically identifies consolidation zones using a narrow-range logic relative to ATR. When a valid box forms, the structure is drawn on the chart. If price closes beyond the upper or lower edge of that box, the script registers a breakout or breakdown and assigns a quality score. A throwback event can also be tracked after the break, helping users distinguish cleaner expansions from breaks that immediately revisit the zone.
This makes the script useful for traders who want to monitor compression-to-expansion behavior in a structured way. It can be used to review developing ranges, compare breakout quality across instruments, and filter visual attention toward stronger or weaker breakout events without turning the chart into a cluttered signal feed.
Unique Edge
The differentiating idea behind this tool is that it does not treat consolidation and breakout as two unrelated events. It treats them as one sequence: compression, release, validation, and possible throwback. That sequence is then scored.
Many breakout tools only draw a box or mark the first candle that moves outside a recent range. This script adds a second layer by evaluating the break itself. Volume participation, the strength of the closing position, the duration of the consolidation, and the efficiency of the breakout candle all contribute to the final quality read. If price quickly throws back into the prior box, that weakness is also reflected.
This makes the script a natural sibling to AG Pro Break-Retest Quality, but it is not a duplicate. Break-Retest Quality focuses on retest behavior after a level break. Consolidation Breakout Quality begins one step earlier by focusing on the compression box itself, the first breakout from that structure, and the immediate integrity of that release. The emphasis here is the quality of expansion from consolidation, not the later retest workflow.
Methodology
1) Consolidation detection
The script scans for a sequence of relatively narrow bars. Narrowness is measured against ATR, so the detection logic adapts to the volatility environment of the symbol rather than relying on a fixed tick or percentage threshold. Once the required number of bars is reached, a consolidation box is formed from the local high-low range of that sequence.
2) Breakout / breakdown detection
A bullish breakout is registered when price closes above the upper boundary of the active consolidation box. A bearish breakdown is registered when price closes below the lower boundary. The breakout level is then projected forward visually so the user can continue tracking the structure after the event.
3) Quality scoring
The script assigns a 1 to 5 quality score using a weighted ruleset built around the breakout event:
- Base breakout occurrence
- Relative volume expansion compared with a volume moving average
- Strength of the close beyond the box boundary
- Duration of the consolidation before release
- Body efficiency of the breakout candle
4) Throwback context
After the breakout, the script can monitor whether price returns back into the broken consolidation box within a user-defined lookback window. This is treated as a sign of weaker follow-through and can be displayed directly on the chart for fast context reading.
5) Visual workflow
The chart uses a structured visual hierarchy:
- Consolidation box
- Breakout or breakdown label
- Throwback warning label
- Quality score card
- Breakout level projection
- Compact info panel
The goal is to keep the workflow readable while preserving enough structure for live chart use.
Signals & Alerts
The script can generate alerts for:
- Bullish breakout
- Bearish breakdown
- High-quality breakout conditions
- Elite-quality breakout conditions
- Throwback warning
- Any breakout event
This allows the tool to be used either as a visual chart companion or as part of a broader alert-driven workflow. Users who prefer stricter confirmation logic should configure alerts in a way that matches their execution style.
Key Inputs
Consolidation Settings
- Consolidation Length: number of bars required to form a valid consolidation
- ATR Multiplier: sensitivity threshold for narrow-range detection
- ATR Length: volatility lookback
- Max Zones to Display: keeps chart objects under control
Quality Scoring
- Volume Spike toggle
- Volume MA Length
- Volume Spike Multiplier
- Close Position scoring toggle
- Throwback monitoring toggle
- Throwback lookback length
Visual Settings
- Box color
- Bullish breakout color
- Bearish breakdown color
- Throwback color
- Box, level, score, arrow, and panel visibility
- Label size controls
Alerts
- Minimum score threshold for alert relevance
Limitations & Transparency
This script is a market-structure visualization and event-quality tool. It is not a prediction engine, and it does not claim that every high score will lead to continuation or that every low score will fail. The score is a structured summary of selected breakout characteristics, not a guarantee of outcome.
Consolidation detection depends on the selected ATR settings and bar count. Different symbols, sessions, and timeframes may require different parameter values. Users should expect the frequency and strictness of the boxes to change when those settings are adjusted.
Volume-based logic may be more informative on instruments and venues where reported volume is meaningful. On some markets, volume behavior can be less consistent, which may reduce the usefulness of the volume component.
Throwback detection is intended as context, not as a complete post-break trade management model. A throwback can represent weakness, but in some workflows it may also represent a later confirmation opportunity. The script leaves that interpretation to the user.
Risk Disclosure
This indicator is for chart analysis, structure review, and breakout context evaluation only. It does not provide financial advice, investment recommendations, or guaranteed trade outcomes. All trading and investing involve risk, including the risk of loss. Users should evaluate the tool on their own symbols, timeframes, and execution rules before relying on it in live decision-making.
Nota Keluaran
Update Notes - V2.0* New: Retest Detection
After a breakout, the script now monitors whether price retests the breakout level. If the retest holds — price touches the level but closes back in the breakout direction — a "Retest ✓" marker appears on the chart. The panel shows retest status in real time (Watching → Confirmed ✓). Configurable detection window (default: 15 bars).
* New: Measured Move Target
A target projection line now appears at breakout, calculated as box height × multiplier (default 1.0×) from the breakout level. The panel tracks whether the target has been reached, and the new Statistics row records total breakout count and target hit rate across the entire chart.
* New: Squeeze Alert
When a consolidation zone matures beyond a configurable bar threshold (default: 14 bars), a "⚡ Squeeze Forming" label appears directly on the chart — advance notice before the breakout fires. The label updates its bar count in real time.
* Enhanced: Quality Scoring (7 factors → 5 stars)
Two new scoring factors join the existing five:
• Volume Decline — adds a point when volume decreases during consolidation (classic healthy compression signal)
• Trend Alignment — adds a point when breakout direction matches the EMA trend
The raw score now ranges from 1 to 7 and is capped at 5. A 5-star Elite rating requires most factors to align — making top scores genuinely rare and meaningful.
* Enhanced: Panel — AG Pro Standard v2
• First row is now a merged blue header with just the script name
• New rows: Retest status, Target status, Statistics (breakouts + hit rate)
• Default font size: Small for panel, Normal for labels
• 9-row compact layout
* New: 8 Alert Conditions (up from 6)
• Added: Retest Confirmed — fires when a successful retest is detected
• Added: Squeeze Forming — fires when consolidation reaches squeeze maturity
* Improved: Code Quality
• Removed unused variables
• Fixed volume tracking logic for accurate declining-volume detection
• Better object pool management for target and retest drawings
• Cleaner input organization with grouped emoji headers
Nota Keluaran
Update Notes v2.1This update keeps the original Consolidation Breakout Quality identity intact while making the public chart experience cleaner, sharper, and more distinctive inside the AGPro breakout catalog.
What changed
- Updated the public script title to the current AGPro release standard:
Consolidation Breakout Quality [AGPro Series]
- Preserved the AG Pro identity inside the panel title only:
AG Pro Consolidation Breakout Quality
- Added a new Compression Release Corridor layer.
After a valid consolidation breakout, the script now projects a directional corridor from the broken box edge toward the measured move area. This gives the chart a stronger visual story: compression, release, acceptance tracking, and measured expansion.
- Improved breakout quality scoring.
The model now combines box tightness, volume expansion, compression dry-up, close drive, candle body efficiency, and trend alignment into a cleaner 1 to 5 quality read.
- Added corridor acceptance and failure states.
The script can now identify whether price holds around the broken box edge during the post-break window or fails back through the release level.
- Refined measured move visuals.
Targets are now tied directly to the release corridor, making the post-break structure easier to read without turning the chart into a cluttered signal feed.
- Improved visual hierarchy.
Labels use controlled spacing, adjustable size, ATR-based offsets, and a cooldown setting so important events remain visible without overwhelming the candles.
- Rebuilt the panel using the AGPro standard.
The first panel row is a single merged blue header row containing only the script name. Panel location, panel theme, panel font size, and label font size are all adjustable.
- Applied the AGPro color palette.
The update uses the standard blue header, dark panel base, AGPro bull and bear colors, neutral target tone, and indigo accent for compression structures.
Why this update is different
The script remains a consolidation breakout tool, not a Donchian breakout model, not an ATR envelope breakout model, and not a generic break-retest script. Its core edge is the compression box itself and the quality of the first expansion from that box.
The new Compression Release Corridor strengthens that identity by focusing on what happens immediately after price leaves a mature compression structure. It creates a distinct visual workflow:
Compression Box -> Quality Release -> Release Corridor -> Corridor Hold / Failure -> Measured Move
This makes the script more recognizable, easier to understand at a glance, and better aligned with the AGPro Series premium public-release standard.
Nota Keluaran
UPDATE NOTES - VERSION 2.4This update keeps the readability work from the previous release and simplifies the
panel to a single, stable proof read.
The core purpose of the script remains unchanged. Compression detection, breakout
quality scoring, the release corridor, the measured-move target, the corridor
acceptance and failure logic, and the Next Action read all behave exactly as before.
This release removes a noisy panel row and relies on the release statistics that the
script already tracked.
This script continues to function as an analytical and visualization tool. It does
not attempt to predict price direction or provide guaranteed outcomes.
------------------------
What Changed
------------------------
• Removed the short-window follow-through row
The previous follow-through row sampled only a small recent window, so on higher
timeframes it was based on very few releases and swung between extreme values. It has
been removed in favour of the script's existing, more stable release statistics.
• Release statistics remain as the proof read
The Statistics row continues to report the total number of releases and the share that
reached their measured-move target, accumulated across the full loaded history. This
is the stable, confirmation-anchored read of how releases have resolved.
• Panel simplified
The panel now reads: Next Action, Compression, Last Release, Quality, Corridor, Target,
Volume, and Statistics. The Next Action read remains the lead line.
• Decision group cleaned up
The settings group now contains only the Action Freshness control, which sets how long
a release reads as a fresh, actionable break before the read shifts to manage or hold.
------------------------
Visual Improvements
------------------------
• Tightened the panel by removing a row that did not add stable information.
• Kept the consolidated single-label-per-release layout and the standardized label
sizing from the previous release.
• Preserved the reduced object retention so dense timeframes stay clean.
• Maintained a clear visual hierarchy with the decision read at the top.
------------------------
Interface & Usability
------------------------
• Simplified the panel for a faster read.
• Kept label sizing consistent and controllable through Label Font Size.
• Left all detection and corridor defaults unchanged.
• Enhanced overall clarity without changing the core logic.
------------------------
Behavior Notes
------------------------
This update does not change the core analytical logic of the script. Detection,
scoring, corridor, target, and Next Action behaviour are identical to the previous
version.
The only change is the removal of the short-window follow-through row. The release
statistics that remain are computed the same way as before.
Users should interpret outputs the same way as before.
------------------------
Limitations Reminder
------------------------
The script remains a rule-based analytical tool.
Market conditions such as volatility, liquidity, and timeframe differences may affect
how releases and statistics appear. The target share describes past behaviour over the
loaded history and does not carry forward.
Outputs should always be interpreted within broader market context.
------------------------
Risk Reminder
------------------------
This script is for educational and analytical purposes only.
It does not provide financial advice or guaranteed trading outcomes.
Users remain responsible for their own decisions.
Nota Keluaran
Version 2.8 - Single-Owner Release VisualsThis update removes same-event badge competition and applies adaptive corridor collision control while preserving the V2.7 detection, scoring, outcome, statistics, and alert behavior.
• Replaced the simultaneous completed-box and release-corridor presentation with one dominant visual owner: when corridors are enabled, the completed compression box and its badge are removed as the centered corridor badge takes ownership of the event.
• Preserved completed BULL BOX and BEAR BOX structures with centered badges when release corridors are disabled, so every retained zone still has a visible identity.
• Expanded corridor overlap cleanup with font-aware horizontal padding and ATR-aware vertical padding, removing older nearby corridor, badge, and target-rail sets atomically before a new set is drawn.
• Shortened corridor states to compact BULL/BEAR RELEASE, HOLD, FAIL, and HIT badges, reducing label width without removing direction, grade, or score context.
• Increased the default corridor history from three to four complete non-competing sets, restoring balanced chart presence after redundant same-event structures were removed.
• Kept the breakout engine, quality score, release acceptance, failure and target classification, statistics, panel logic, and seven alert conditions unchanged.

Penafian
Maklumat dan penerbitan adalah tidak bertujuan, dan tidak membentuk, nasihat atau cadangan kewangan, pelaburan, dagangan atau jenis lain yang diberikan atau disahkan oleh TradingView. Baca lebih dalam Terma Penggunaan.
Penafian
Maklumat dan penerbitan adalah tidak bertujuan, dan tidak membentuk, nasihat atau cadangan kewangan, pelaburan, dagangan atau jenis lain yang diberikan atau disahkan oleh TradingView. Baca lebih dalam Terma Penggunaan.